


监控系统概述:
什么是监控?
监控系统是整个运维环节,乃至整个产品生命周期中最重要的一环,事前及时预警发现故障,事后提供翔实的数据用于追查定位问题。
为什么要做监控?
生活中:
- 1.超市监控:防内外偷
- 2.交通监控:测速,违章
企业中:
- 1.系统的监控:实际上是对系统不间断的实时监控
- 2.实时反馈系统当前状态:我们监控某个硬件、或者某个系统,都是需要能实时看到当前系统的状态,是正常、异常、或者故障。
- 3.保证服务可靠性安全性:我们监控的目的就是要保证系统、服务、业务正常运行
- 4.保证业务持续稳定运行:如果我们的监控做得很完善,即使出现故障,能第一时间接收到故障报警,在第一时间处理解决,从而保证业务持续性的稳定运行。(往往,第一时间知道业务宕机的都是用户)
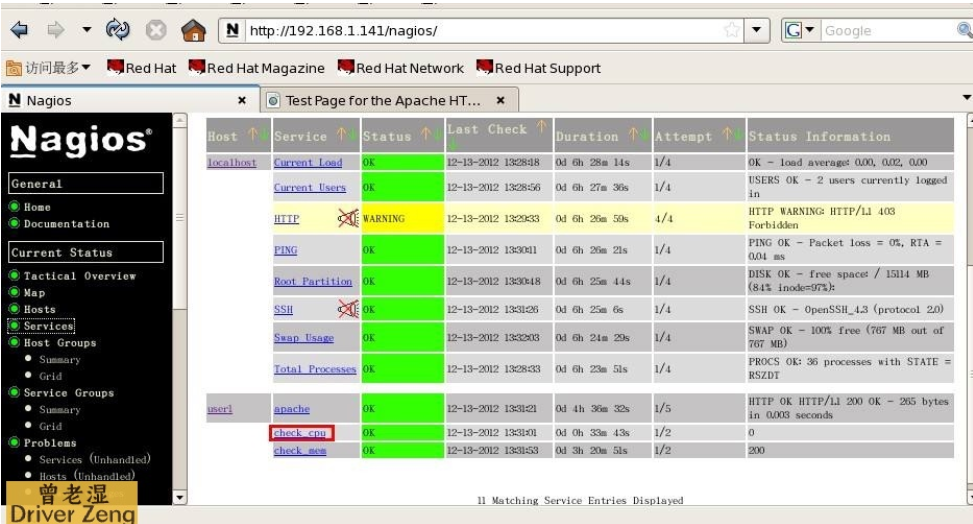
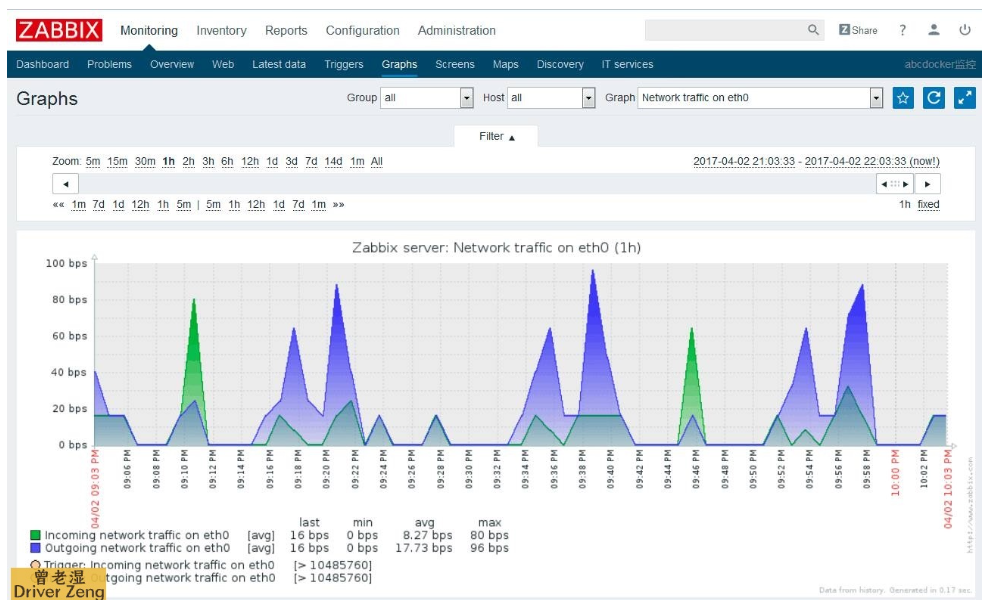
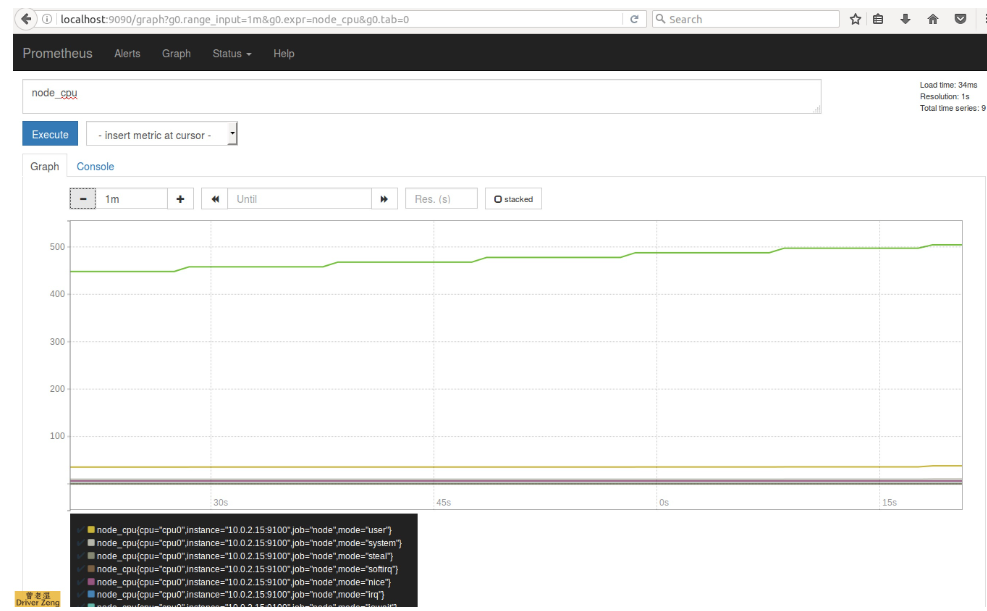
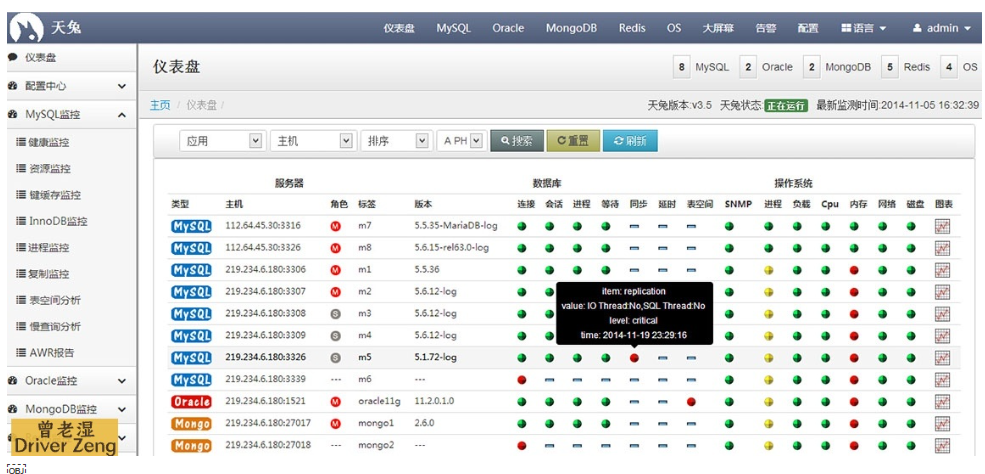
常用的监控软件:
CACTI(网络监控)


单机监控命令了解
CPU监控命令
1)w
[root@zabbix ~]# w
 15:09:01 up  7:29,  1 user,  load average: 0.55, 0.15, 0.09
USER     TTY      FROM             LOGIN@   IDLE   JCPU   PCPU WHAT
root     pts/0    10.0.0.1         07:58    5.00s  0.69s  0.00s w
2)top
[root@zabbix ~]# top
top - 15:09:44 up  7:30,  1 user,  load average: 0.26, 0.13, 0.08
Tasks: 161 total,   2 running, 159 sleeping,   0 stopped,   0 zombie
%Cpu(s):  0.3 us,  0.3 sy,  0.0 ni, 99.3 id,  0.0 wa,  0.0 hi,  0.0 si,  0.0 st
KiB Mem :   995896 total,   170500 free,   275796 used,   549600 buff/cache
KiB Swap:  4190204 total,  4189940 free,      264 used.   518484 avail Mem
3)htop
[root@zabbix ~]# htop
 CPU[|                                                                0.7%]   Tasks: 27, 38 thr; 1 running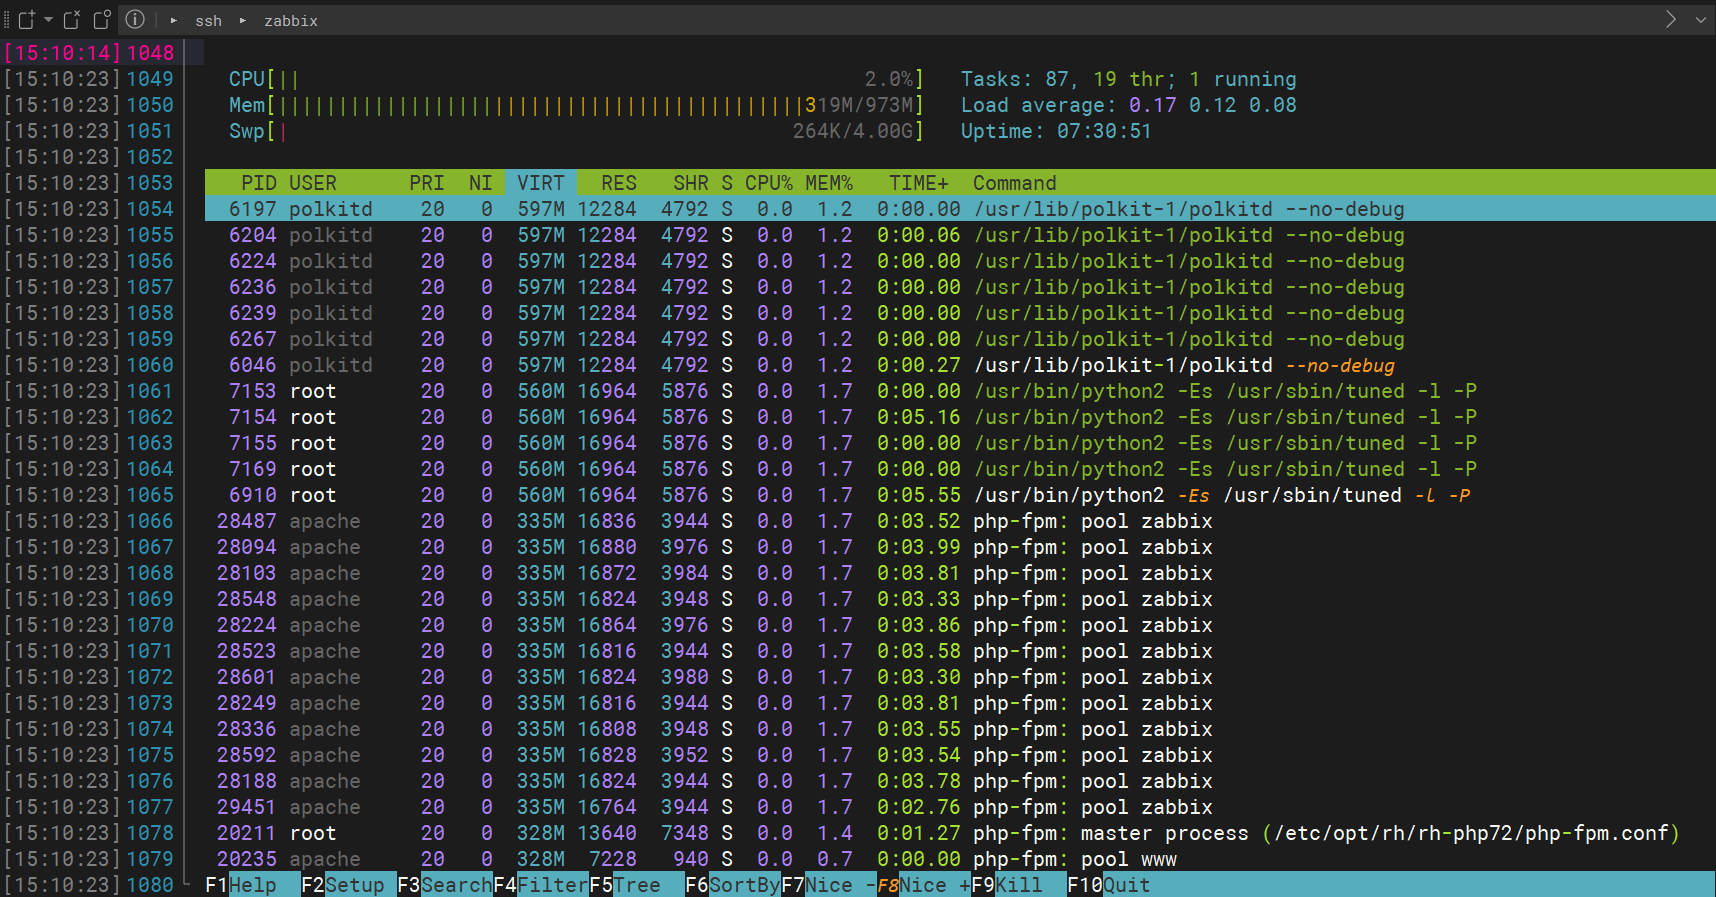
4)glances
zabbix (CentOS Linux 7.6.1810 64bit / Linux 3.10.0-957.el7.x86_64)                                             Uptime: 7:33:03

CPU  [|           12.9%]   CPU      12.9%  nice:     0.0%   MEM     48.5%  active:     351M   SWAP      0.0%   LOAD    1-core
MEM  [|||||       48.5%]   user:     8.8%  irq:      0.0%   total:   973M  inactive:   296M   total:   4.00G   1 min:    0.30
SWAP [             0.0%]   system:   3.5%  iowait:   0.0%   used:    472M  buffers:       0   used:     264K   5 min:    0.16
                           idle:    87.4%  steal:    0.0%   free:    501M  cached:     496M   free:    4.00G   15 min:   0.10
                  free:   1.68G  cached:     319M                    free:    1024M                    15 min:   0.07
5)uptime
[root@zabbix ~]# uptime
 15:13:17 up  7:33,  1 user,  load average: 0.18, 0.14, 0.09
不管用什么命令监控,查看CPU,我们都必须了解,系统的用户态和内和态。
%Cpu(s):  0.0 us,  0.0 sy,  0.0 ni,100.0 id,  0.0 wa,  0.0 hi,  0.0 si,  0.0 st

us: 用户态     跟用户的操作有关35%
sy: 内和态     跟内核的处理有关65%
id: CPU空闲
当我们执行一个命令的时候,很快能出来结果,但是有多少人知道,这个很快,他都占用了哪些时间呢?
[root@zabbix ~]# time ls
backup.sh  group_vars_web_group

real    0m0.002s       真实执行时间
user    0m0.001s       用户执行时间
sys 0m0.001s       系统执行时间
内存监控命令
1)free
[root@zabbix ~]# free -m
              total        used        free      shared  buff/cache   available
Mem:            972         263         171           9         537         512
Swap:          4091           0        4091
[root@zabbix ~]# free -h
              total        used        free      shared  buff/cache   available
Mem:           972M        263M        171M        9.7M        537M        512M
2)top
3)glances
4)htop
这几个命令在看CPU的时候已经演示了
如何查看单个进程占用内存?
#进程占用内存公式
pmem = VmRSS / MemTotal * 100
process mem = 虚拟内存 / 总内存 * 100

#python脚本:
[root@zabbix ~]# cat mem.py
#!/usr/bin/env python
# _*_ coding:UTF-8 _*_
# 收集程序所占用的物理内存大小,占所有物理内存的比例
# Python: 2.7.6

import sys
import os
from subprocess import Popen,PIPE

def get_pid(program):
    '获取目标程序的PID列表'
    p = Popen(['pidof',program],stdout=PIPE,stderr=PIPE)
    pids,stderrput = p.communicate()
#     pids = p.stdout.read()  #这种方法也是可以的
#     这里也可以对stderrput来进行判断
    if pids:
        return pids.split()
    else:
        raise ValueError

def mem_calc(pids):
    '计算PIDs占用的内存大小'
    mem_total = 0
    for pid in pids:
        os.chdir('/proc/%s' % pid)
        with open('status') as fd:
            for line in fd:
                if line.startswith('VmRSS'):
                    mem = line.strip().split()[1]
                    mem_total += int(mem)
                    break
    return mem_total

def mem_percent(mem):
    '计算程序内存占用物理内存的百分比'
    with open('/proc/meminfo') as fd:
        for line in fd:
            if line.startswith('MemTotal'):
                total = line.strip().split()[1]
        percent = (float(mem)/int(total)) * 100
    return percent

def main():
    try:
        program = sys.argv[1]
        pids = get_pid(program)
    except IndexError as e:
        sys.exit('%s need a Program name ' % __file__)
    except ValueError as e:
        sys.exit('%s not a Process Name or not Start' % program )
    mem_total = mem_calc(pids)
    percent = mem_percent(mem_total)
    return program,mem_total,percent

if __name__ == '__main__':
    program,mem_total,mem_percent=main()
    print('进程名称:%s\n物理内存为:%s\n百分比为:%.2f%%'% (program,mem_total,mem_percent))
磁盘监控命令
1)df
[root@zabbix ~]# df
Filesystem              1K-blocks    Used Available Use% Mounted on
/dev/mapper/centos-root  15718400 2092324  13626076  14% /
devtmpfs                   485828       0    485828   0% /dev
tmpfs                      497948       0    497948   0% /dev/shm
tmpfs                      497948    7780    490168   2% /run
tmpfs                      497948       0    497948   0% /sys/fs/cgroup
/dev/sda1                 1038336  135284    903052  14% /boot
tmpfs                       99592       0     99592   0% /run/user/0
[root@zabbix ~]# df -h
Filesystem               Size  Used Avail Use% Mounted on
/dev/mapper/centos-root   15G  2.0G   13G  14% /
devtmpfs                 475M     0  475M   0% /dev
tmpfs                    487M     0  487M   0% /dev/shm
tmpfs                    487M  7.6M  479M   2% /run
tmpfs                    487M     0  487M   0% /sys/fs/cgroup
/dev/sda1               1014M  133M  882M  14% /boot
tmpfs                     98M     0   98M   0%
2)iotop //用于监控系统中磁盘I/O活动的命令行工具
[root@zabbix ~]# iotop
Total DISK READ :       0.00 B/s | Total DISK WRITE :       0.00 B/s
Actual DISK READ:       0.00 B/s | Actual DISK WRITE:       0.00 B/s
   TID  PRIO  USER     DISK READ  DISK WRITE  SWAPIN     IO>    COMMAND
     1 be/4 root        0.00 B/s    0.00 B/s  0.00 %  0.00 % systemd --switched-root --system --deserialize 22
     2 be/4 root        0.00 B/s    0.00 B/s  0.00 %  0.00 % [kthreadd]
     3 be/4 root        0.00 B/s    0.00 B/s  0.00 %  0.00 % [ksoftirqd/0]
  6148 be/4 root        0.00 B/s    0.00 B/s  0.00 %  0.00 % gssproxy -D
     5 be/0 root        0.00 B/s    0.00 B/s  0.00 %  0.00 % [kworker/0:0H]
  6150 be/4 root        0.00 B/s    0.00 B/s  0.00 %  0.00 % gssproxy -D
     7 rt/4 root        0.00 B/s    0.00 B/s  0.00 %  0.00 % [migration/0]
     8 be/4 root        0.00 B/s    0.00 B/s  0.00 %  0.00 % [rcu_bh]
#常用选项
-o:只显示有io操作的进程
-b:批量显示,无交互,主要用作记录到文件。
-n NUM:显示NUM次,主要用于非交互式模式。
-d SEC:间隔SEC秒显示一次。
-p PID:监控的进程pid。
-u USER:监控的进程用户。
3)iostat
[root@zabbix ~]# iostat
Linux 3.10.0-957.el7.x86_64 (zabbix)    08/14/2023      _x86_64_        (1 CPU)

avg-cpu:  %user   %nice %system %iowait  %steal   %idle
           2.89    0.00    1.42    0.07    0.00   95.62

Device:            tps    kB_read/s    kB_wrtn/s    kB_read    kB_wrtn
scd0              0.00         0.04         0.00       1028          0
sda               0.93        12.46        35.61     345535     987391
dm-0              1.01        12.01        35.53     333038     985251
dm-1              0.00         0.09         0.00       2460         72
#选项
-C 显示CPU使用情况
-d 显示磁盘使用情况
-k 以 KB 为单位显示
-m 以 M 为单位显示
-N 显示磁盘阵列(LVM) 信息
-n 显示NFS 使用情况
-p[磁盘] 显示磁盘和分区的情况
-t 显示终端和CPU的信息
-x 显示详细信息
-V 显示版本信息
#示例
[root@zabbix ~]# iostat -d -k 1 10

参数 -d 表示,显示设备(磁盘)使用状态;-k某些使用block为单位的列强制使用Kilobytes为单位;1 10表示,数据显示每隔1秒刷新一次,共显示10次。
4)dstat
[root@zabbix ~]# dstat -cdngy
----total-cpu-usage---- -dsk/total- -net/total- ---paging-- ---system--
usr sys idl wai hiq siq| read  writ| recv  send|  in   out | int   csw
  0   0 100   0   0   0|1729B 3483B|   0     0 |   0     0 |  47    65
  0   0 100   0   0   0|   0     0 |  66B  830B|   0     0 |  92   114
  0   0 100   0   0   0|   0     0 |  66B  350B|   0     0 |  92   106
  0   0 100   0   0   0|   0    16k|  66B  350B|   0     0 | 102   114
5)glances
前面有过讲解
网络监控命令
1)glances
参考前面
2)iftop
3)nethogs
该命令可以查看某个进程所使用的流量
[root@zabbix ~]# nethogs
[root@zabbix ~]# nethogs
Ethernet link detected
                      Ethernet link detected
                                            Waiting for first packet to arrive (see sourceforge.net bug 1019381)
NetHogs version 0.8.5

    PID USER     PROGRAM                                                                  DEV        SENT      RECEIVED
  20272 zabbix   ..sr/sbin/zabbix_server: escalator #1 [processed 0 escalations in 0.007  eth1        0.425       0.941 KB/sec
  20288 zabbix   ..sr/sbin/zabbix_server: alert syncer [queued 0 alerts(s), flushed 0 re  eth1        0.581       0.922 KB/sec
  28249 apache   php-fpm: pool zabbix                                                     eth1        0.485       0.749 KB/sec
  20268 zabbix   ..sr/sbin/zabbix_server: history syncer #1 [processed 1 values, 0 trigg  eth1        0.629       0.436 KB/sec
  20266 zabbix   ..sr/sbin/zabbix_server: http poller #1 [got 0 values in 0.002169 sec,   eth1        0.177       0.238 KB/sec
  20348 apache   nginx: worker process                                                    eth0        0.131       0.148 KB/sec
  20275 zabbix   ..sr/sbin/zabbix_server: task manager [processed 0 task(s) in 0.001446   eth1        0.042       0.056 KB/sec
   7181 root     sshd: root@pts/0                                                         eth0        0.380       0.047 KB/sec
  20283 zabbix   ..sr/sbin/zabbix_server: trapper #2 [processed data in 0.008876 sec, wa  eth1        0.053       0.038 KB/sec
  20267 zabbix   ..sr/sbin/zabbix_server: discoverer #1 [processed 0 rules in 0.002010 s  eth1        0.000       0.000 KB/sec
  28103 apache   php-fpm: pool zabbix                                                     eth1        0.000       0.000 KB/sec
      ? root     unknown TCP                                                                          0.000       0.000 KB/sec

  TOTAL                                                                                               2.902       3.575 KB/sec
                                                                                                                                                                                                               0.131       0.064 KB/sec
4)ifconfig
[root@zabbix ~]# ifconfig
eth0: flags=4163<UP,BROADCAST,RUNNING,MULTICAST>  mtu 1500
        inet 10.0.0.71  netmask 255.255.255.0  broadcast 10.0.0.255
        inet6 fe80::20c:29ff:fe33:a775  prefixlen 64  scopeid 0x20<link>
        ether 00:0c:29:33:a7:75  txqueuelen 1000  (Ethernet)
        RX packets 145559  bytes 152747440 (145.6 MiB)
        RX errors 0  dropped 0  overruns 0  frame 0
        TX packets 120756  bytes 139243764 (132.7 MiB)
        TX errors 0  dropped 0 overruns 0  carrier 0  collisions 0

eth1: flags=4163<UP,BROADCAST,RUNNING,MULTICAST>  mtu 1500
        inet 172.16.1.71  netmask 255.255.255.0  broadcast 172.16.1.255
        inet6 fe80::20c:29ff:fe33:a77f  prefixlen 64  scopeid 0x20<link>
        ether 00:0c:29:33:a7:7f  txqueuelen 1000  (Ethernet)
        RX packets 383885  bytes 175130867 (167.0 MiB)
        RX errors 0  dropped 0  overruns 0  frame 0
        TX packets 410113  bytes 70357312 (67.0 MiB)
        TX errors 0  dropped 0 overruns 0  carrier 0  collisions 0

lo: flags=73<UP,LOOPBACK,RUNNING>  mtu 65536
        inet 127.0.0.1  netmask 255.0.0.0
        inet6 ::1  prefixlen 128  scopeid 0x10<host>
        loop  txqueuelen 1000  (Local Loopback)
        RX packets 112426  bytes 6853247 (6.5 MiB)
        RX errors 0  dropped 0  overruns 0  frame 0
        TX packets 112426  bytes 6853247 (6.5 MiB)
        TX errors 0  dropped 0 overruns 0  carrier 0  collisions 0
#左边的RX:接收流量;右边的TX:发送流量
5)route
[root@zabbix ~]# route
Kernel IP routing table
Destination     Gateway         Genmask         Flags Metric Ref    Use Iface
default         gateway         0.0.0.0         UG    0      0        0 eth0
10.0.0.0        0.0.0.0         255.255.255.0   U     0      0        0 eth0
link-local      0.0.0.0         255.255.0.0     U     1002   0        0 eth0
link-local      0.0.0.0         255.255.0.0     U     1003   0        0 eth1
172.16.1.0      0.0.0.0         255.255.255.0   U     0      0        0 eth1
route 命令的输出项说明

输出项 说明

Destination 目标网段或者主机
Gateway 网关地址,”*” 表示目标是本主机所属的网络,不需要路由
Genmask 网络掩码
Flags   标记。一些可能的标记如下:
    U — 路由是活动的
    H — 目标是一个主机
    G — 路由指向网关
    R — 恢复动态路由产生的表项
    D — 由路由的后台程序动态地安装
    M — 由路由的后台程序修改
    ! — 拒绝路由
Metric  路由距离,到达指定网络所需的中转数(linux 内核中没有使用)
Ref 路由项引用次数(linux 内核中没有使用)
Use 此路由项被路由软件查找的次数
Iface   该路由表项对应的输出接口
TCP11种状态监控命令
1)netstat
[root@zabbix ~]# netstat
Active Internet connections (w/o servers)
Proto Recv-Q Send-Q Local Address           Foreign Address         State
tcp        0      0 zabbix:zabbix-trapper   zabbix:52596            TIME_WAIT
tcp        0      0 zabbix:54222            172.16.1.51:mysql       ESTABLISHED
tcp        0      0 zabbix:54220            172.16.1.51:mysql       ESTABLISHED
tcp        0      0 zabbix:54224            172.16.1.51:mysql       ESTABLISHED
tcp        0      0 zabbix:54256            172.16.1.51:mysql       ESTABLISHED
tcp        0      0 zabbix:54248            172.16.1.51:mysql       ESTABLISHED
tcp        0      0 zabbix:54262            172.16.1.51:mysql       ESTABLISHED
tcp        0      0 zabbix:55952            172.16.1.51:mysql       TIME_WAIT
tcp        0      0 zabbix:54218            172.16.1.51:mysql       ESTABLISHED
tcp        0      0 localhost:zabbix-agent  localhost:49088         TIME_WAIT
tcp        0      0 zabbix:zabbix-trapper   zabbix:52618            TIME_WAIT
tcp        0      0 localhost:zabbix-agent  localhost:49030         TIME_WAIT
2)ss
[root@zabbix ~]# ss
Netid  State      Recv-Q Send-Q             Local Address:Port                              Peer Address:Port
u_str  ESTAB      0      0                              * 37472                                        * 37473
u_str  ESTAB      0      0                              * 111273                                       * 111272
u_str  ESTAB      0      0      /run/systemd/journal/stdout 33080                                        * 33079
u_str  ESTAB      0      0                              * 33984                                        * 33983
u_str  ESTAB      0      0      /run/systemd/journal/stdout 32743                                        * 32742
u_str  ESTAB      0      0                              * 37233                                        * 37232
u_str  ESTAB      0      0                              * 33079                                        * 33080
u_str  ESTAB      0      0      /run/systemd/journal/stdout 36650                                        * 36649
企业示例
如何每1分钟监控当前系统的内存使用状态,如果可用低于100MB则发送邮件。同时打印当前还剩余多少内存
1.如何获取内存的状态信息 free -m
2.如何获取内存的可用状态 free -m|awk '/Mem/{print $NF}'
3.如何进行数字的比对,高于100MB不处理,低于100MB,发送邮件。
4.如何每分钟执行。
[root@zabix~]# vim free.sh
#!/bin/bash
while true;do
  free_av=$(free -m|awk '/^Mem/{print $NF}')
  Hostname=$(hostname)_$(hostname -I|awk '{print $2}')
  Date=$(date +%F)

  if [ $free_av -lt 100 ];then
    echo "$Date: ${Hostname},内存低于100MB,还有${free_av}MB内存可用"
  fi
      sleep 2
done

[root@zabbix ~]# sh free.sh
2018-10-12: zabbix_,内存低于100MB,还有20MB内存可用
2018-10-12: zabbix_,内存低于100MB,还有6MB内存可用
2018-10-12: zabbix_,内存低于100MB,还有5MB内存可用
#拿取数据
[root@zabbix ~]# dd < /dev/zero > /dev/null bs=2000M
zabbix监控快速安装(5.0版本)
#下载更换源
rpm -Uvh https://repo.zabbix.com/zabbix/5.0/rhel/7/x86_64/zabbix-release-5.0-1.el7.noarch.rpm
#安装zabbix
yum install zabbix-server-mysql zabbix-agent -y
#下载前端源
yum install centos-release-scl -y
#编辑文件 /etc/yum.repos.d/zabbix.repo 并启用 zabbix-frontend 存储库
[zabbix-frontend]
...
enabled=1
...
#安装 Zabbix 前端包
yum install zabbix-web-mysql-scl zabbix-nginx-conf-scl -y
#创建初始数据库,确保数据库服务器已启动并正在运行。,在您的数据库主机上运行以下命令。
mysql> create database zabbix character set utf8 collate utf8_bin;
mysql> grant all on zabbix.* to zabbix@'172.16.1.%' identified by '123';
mysql> set global log_bin_trust_function_creators = 1; #//临时开启函数调用
mysql> quit;
#在 Zabbix 服务器主机上导入初始架构和数据。
scp /usr/share/doc/zabbix-server-mysql*/create.sql.gz 172.16.1.51:/root
zcat create.sql.gz | mysql zabbix
#导入数据库模式后禁用 log_bin_trust_function_creators 选项。
mysql> set global log_bin_trust_function_creators = 0;
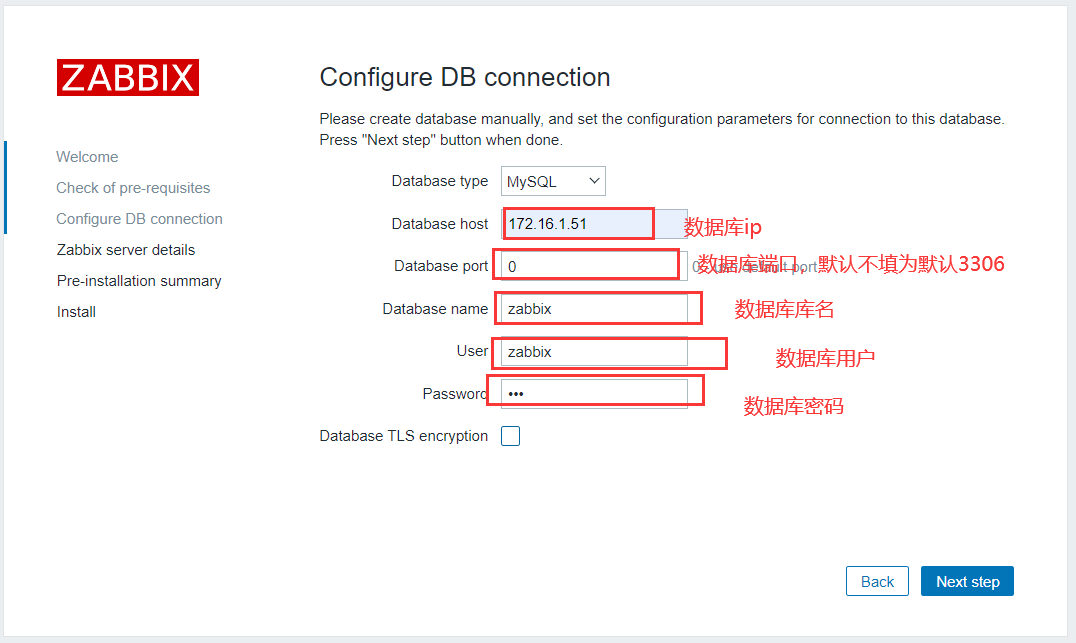
#为Zabbix服务器配置数据库 //数据库部署在那台服务器就填那台ip
编辑文件/etc/zabbix/zabbix_server.conf
[root@zabbix ~]# cat /etc/zabbix/zabbix_server.conf | grep '^DB'
DBHost=172.16.1.51
DBName=zabbix
DBUser=zabbix
DBPassword=123
#为 Zabbix 前端配置 PHP //如果使用ip访问则需要注释或者删掉自带的conf文件中的server段 文件路径:/etc/opt/rh/rh-nginx116/nginx/nginx.conf
编辑文件 /etc/opt/rh/rh-nginx116/nginx/conf.d/zabbix.conf 取消注释并设置“listen”和“server_name”指令。
listen 80;
server_name _;
、、、、、
#编辑文件 /etc/opt/rh/rh-php72/php-fpm.d/zabbix.conf 将 nginx 添加到 Listen.acl_users 指令。
listen.acl_users = apache,nginx
php_value[date.timezone] = Asia/Shanghai
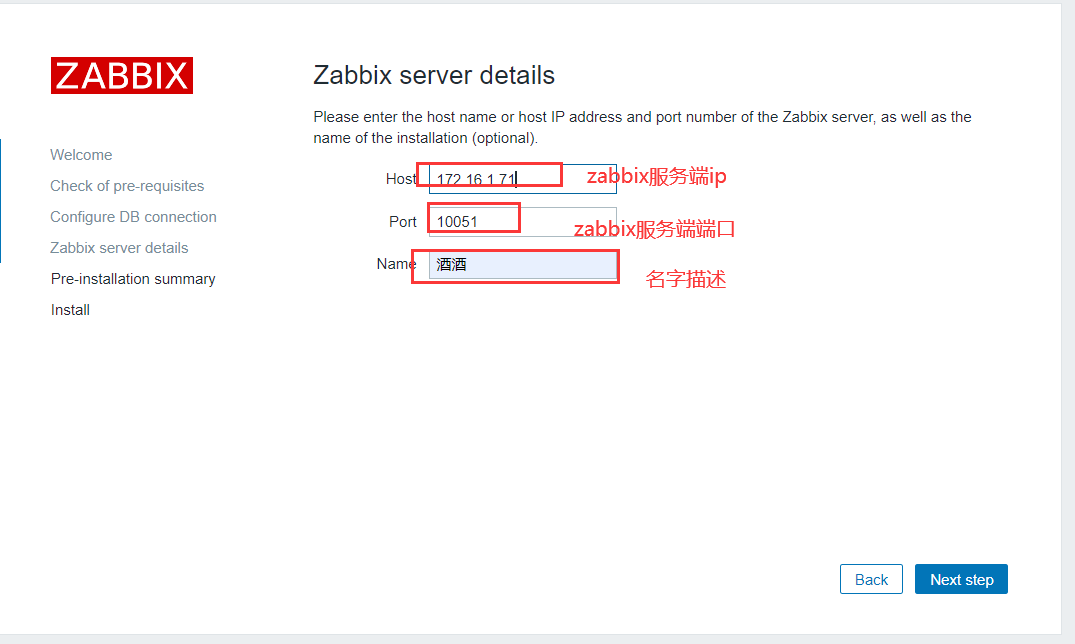
#启动Zabbix服务器和代理进程
启动 Zabbix 服务器和代理进程,并使其在系统启动时启动。
systemctl start zabbix-server zabbix-agent rh-nginx116-nginx rh-php72-php-fpm
开机自启:
systemctl enable zabbix-server zabbix-agent rh-nginx116-nginx rh-php72-php-fpm
#端口检测
[root@zabbix ~]# netstat -lntup
Active Internet connections (only servers)
Proto Recv-Q Send-Q Local Address Foreign Address State PID/Program name
tcp 0 0 127.0.0.1:9000 0.0.0.0:* LISTEN 8969/php-fpm: maste
tcp 0 0 0.0.0.0:111 0.0.0.0:* LISTEN 6011/rpcbind
tcp 0 0 0.0.0.0:80 0.0.0.0:* LISTEN 9014/nginx: master
tcp 0 0 0.0.0.0:22 0.0.0.0:* LISTEN 6917/sshd
tcp 0 0 127.0.0.1:25 0.0.0.0:* LISTEN 7065/master
tcp 0 0 0.0.0.0:10050 0.0.0.0:* LISTEN 8975/zabbix_agentd
tcp 0 0 0.0.0.0:10051 0.0.0.0:* LISTEN 8984/zabbix_server
tcp6 0 0 :::111 :::* LISTEN 6011/rpcbind
tcp6 0 0 :::22 :::* LISTEN 6917/sshd
tcp6 0 0 ::1:25 :::* LISTEN 7065/master
tcp6 0 0 :::10050 :::* LISTEN 8975/zabbix_agentd
tcp6 0 0 :::10051 :::* LISTEN 8984/zabbix_server
udp 0 0 0.0.0.0:613 0.0.0.0:* 6011/rpcbind
udp 0 0 0.0.0.0:111 0.0.0.0:* 6011/rpcbind
udp6 0 0 :::613 :::* 6011/rpcbind
udp6 0 0 :::111 :::* 6011/rpcbind
#浏览器访问
10.0.0.71
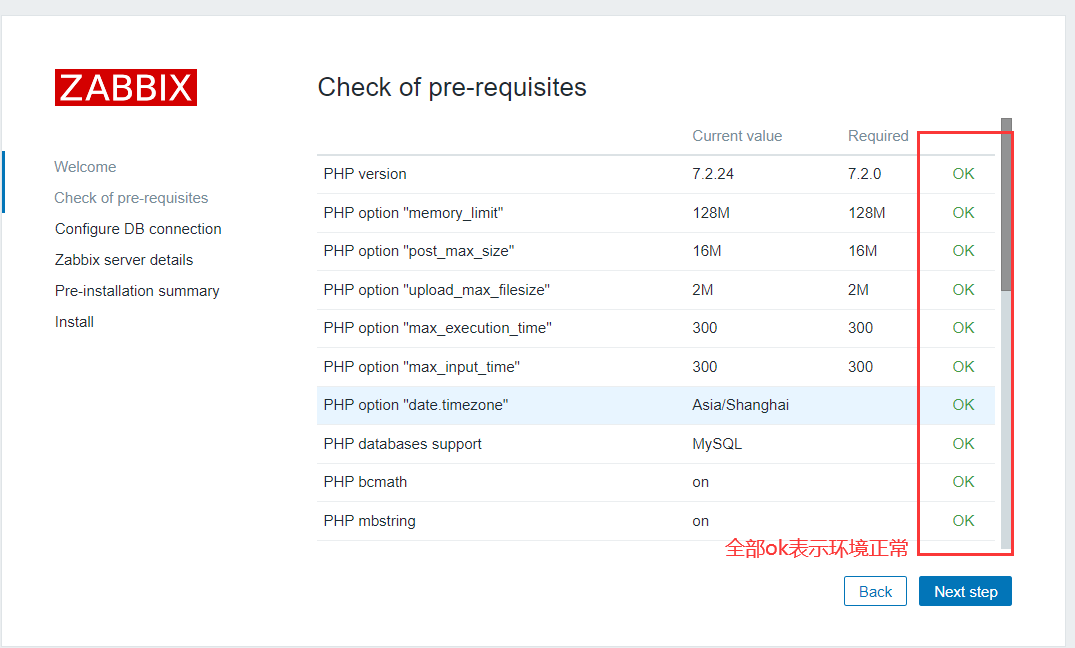
界面汉化:
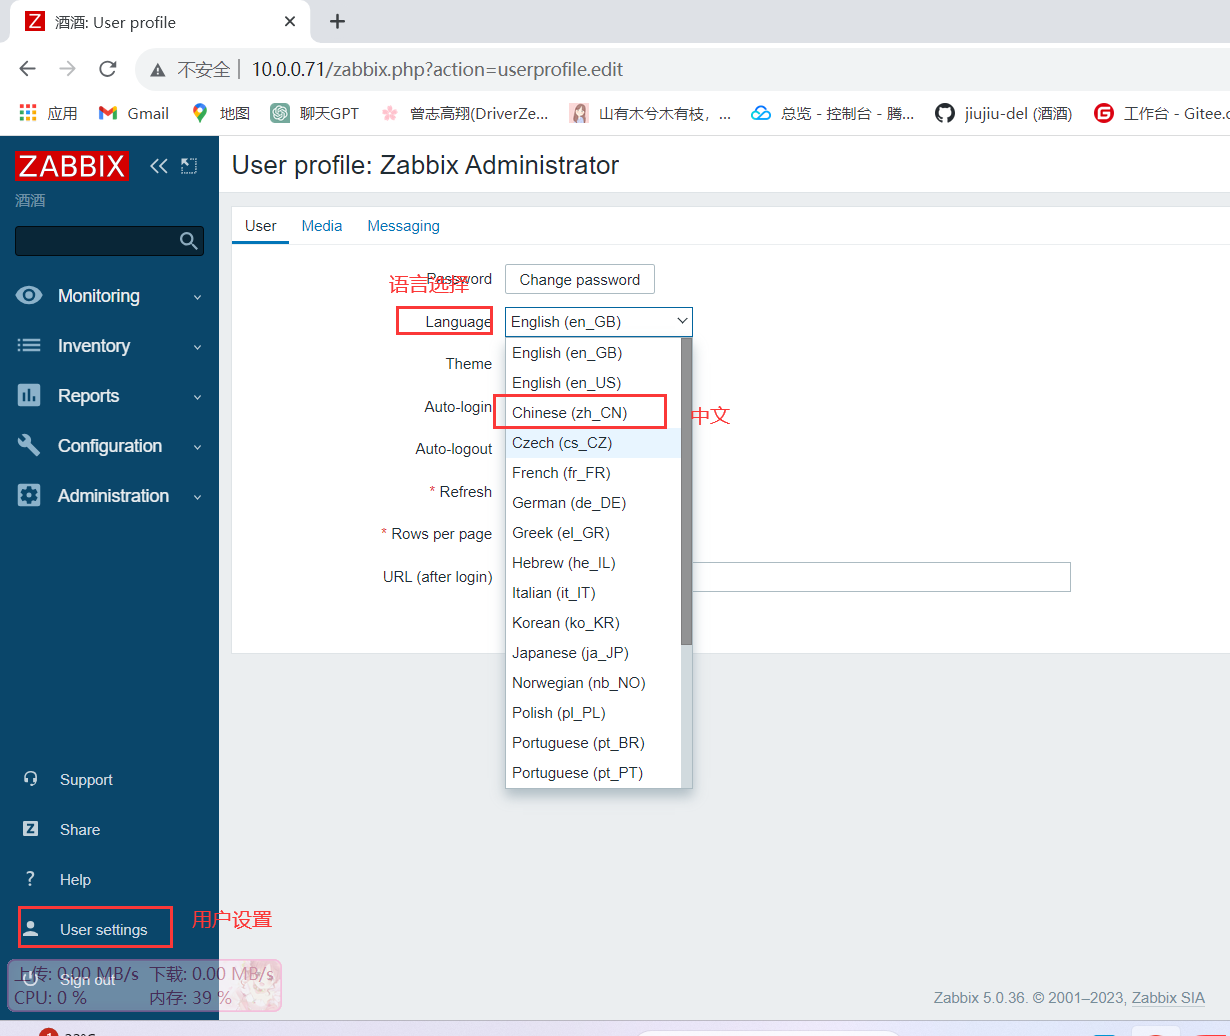
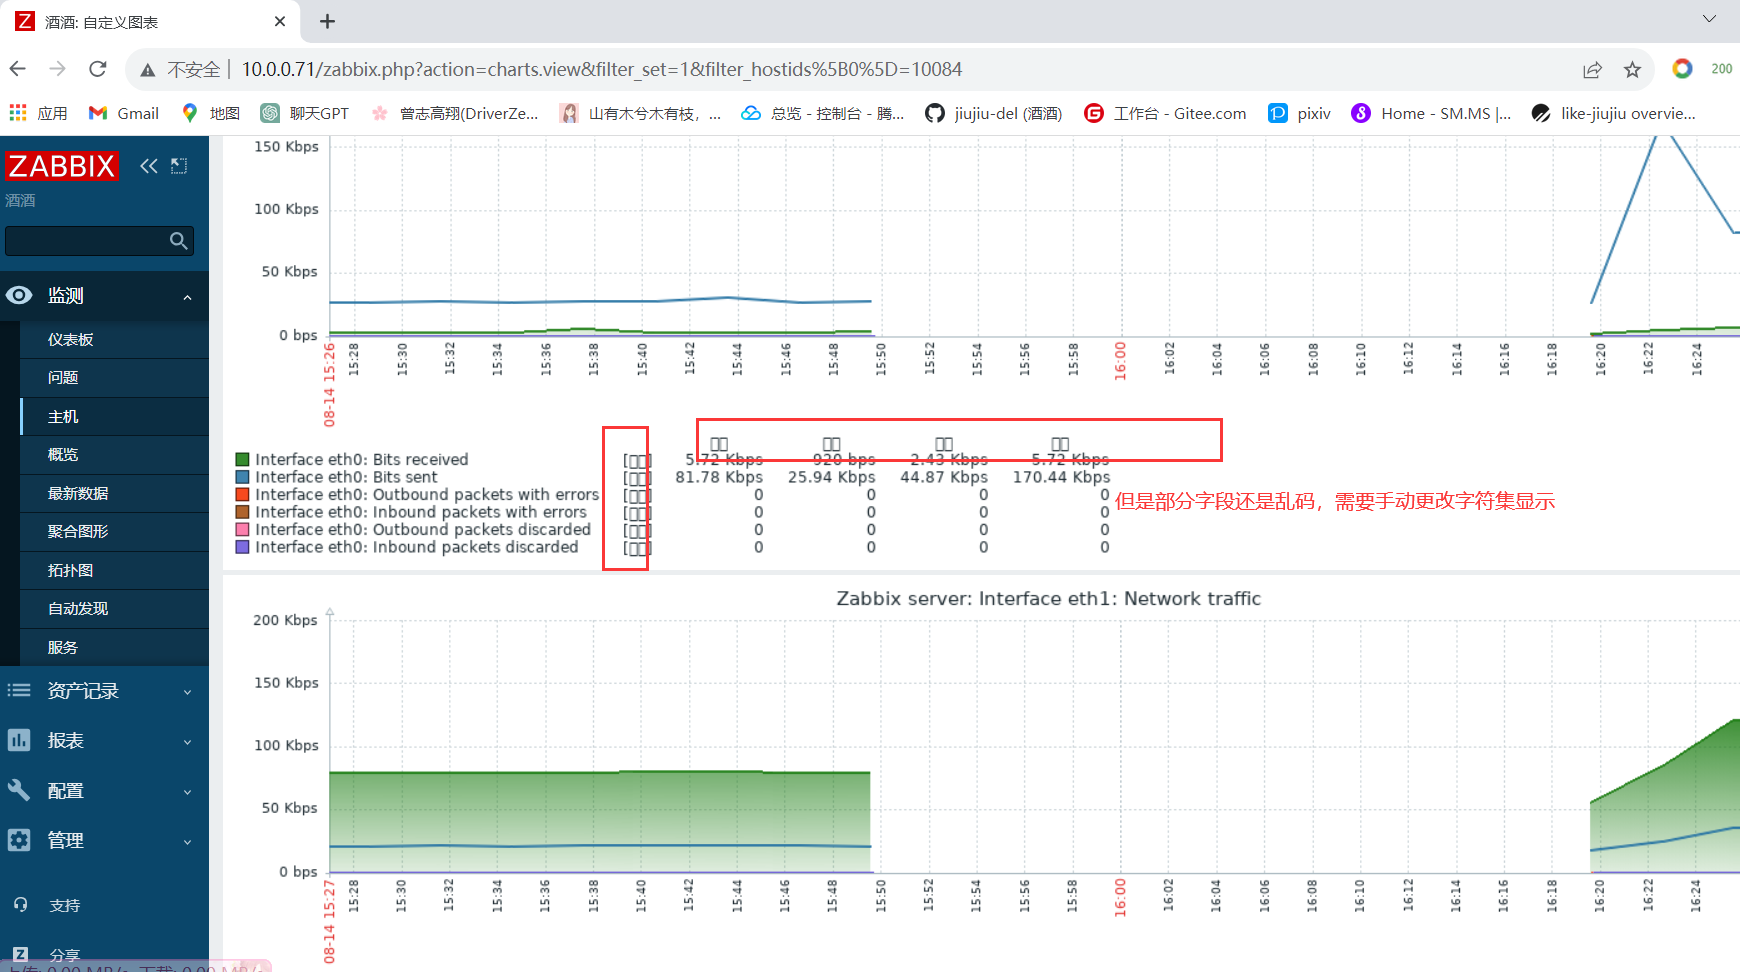
配置UTF-8字符集:
[root@zabbix assets]# cd /usr/share/zabbix/assets/fonts/
[root@zabbix fonts]# ll
total 0
lrwxrwxrwx 1 root root 33 Aug 14 16:04 graphfont.ttf -> /etc/alternatives/zabbix-web-font
#在windows中C:\Windows\Fonts 选择 任意中文简体字体复制到上面目录中
[root@zabbix fonts]# ll
total 17588
lrwxrwxrwx 1 root root       33 Aug 14 16:04 graphfont.ttf -> /etc/alternatives/zabbix-web-font
-rw-rw-rw- 1 root root 18008680 Jul 27 08:04 SIMSUN.TTC
#删除原先graphfont.ttf软链接,把加入的字符集更改为graphfont.ttf,刷新网页即可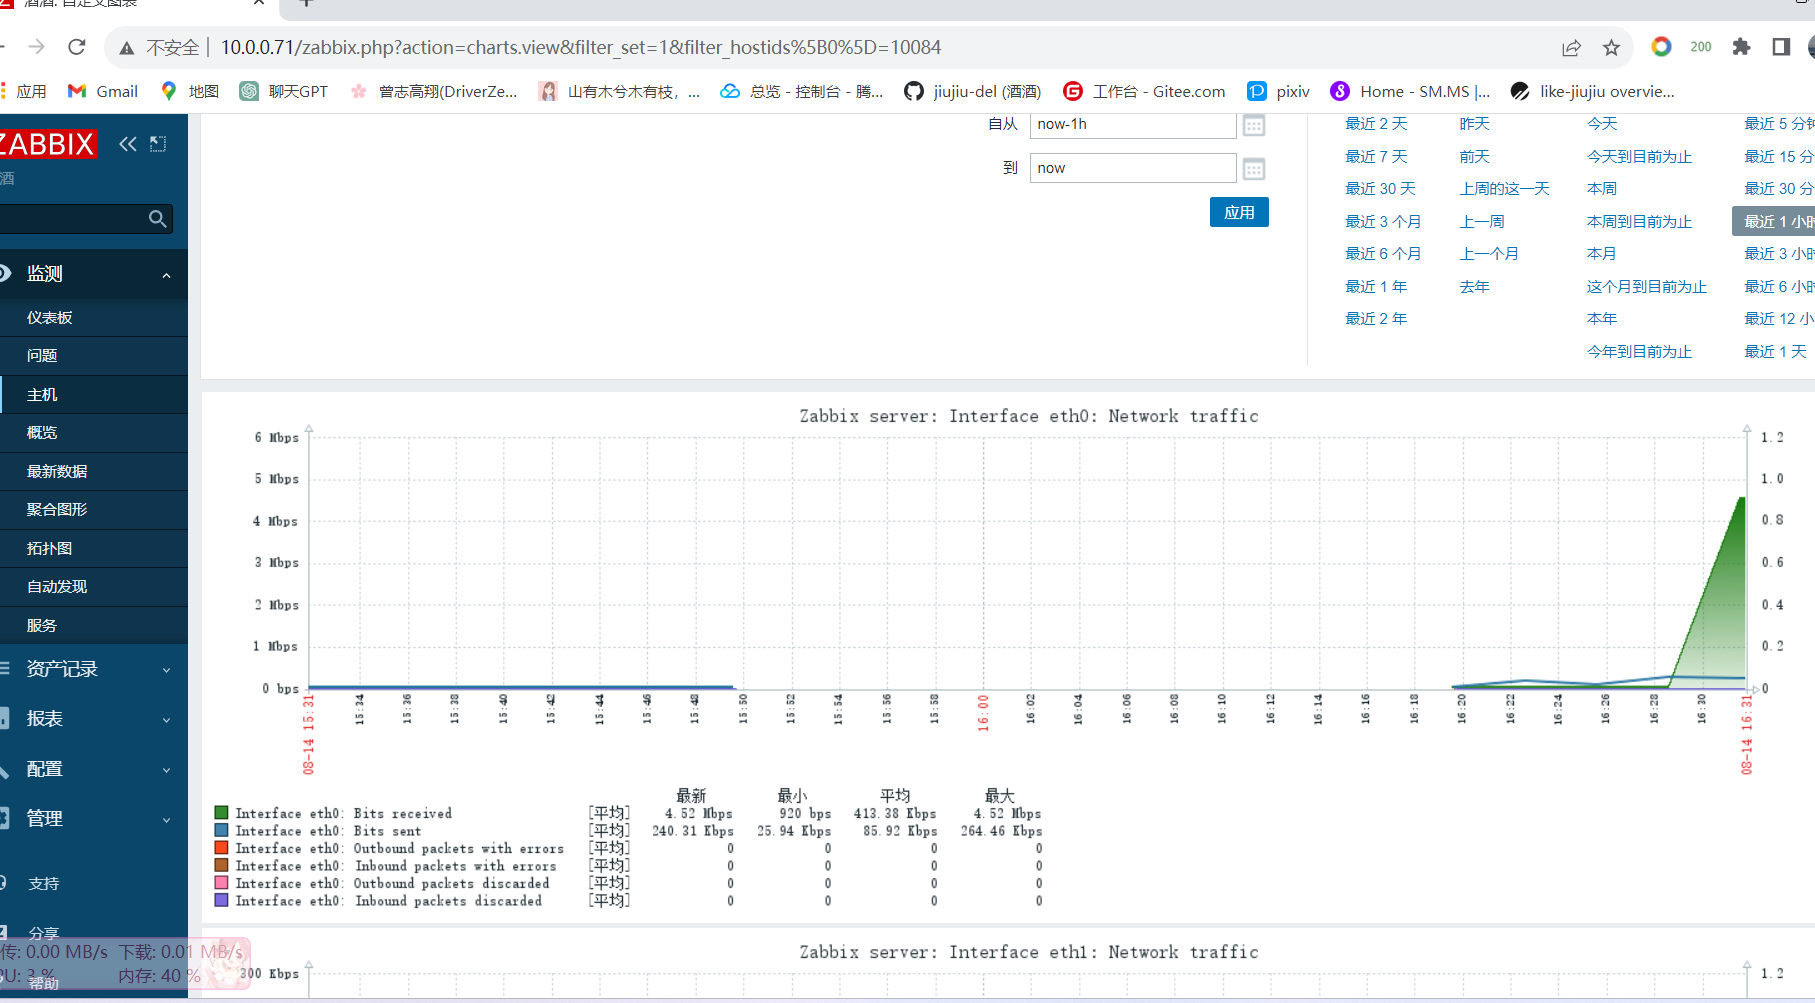
3.0安装部署
#下载更换源
rpm -ivh https://mirrors.tuna.tsinghua.edu.cn/zabbix/zabbix/3.4/rhel/7/x86_64/zabbix-release-3.4-2.el7.noarch.rpm
#下载安装zabbix
yum -y install zabbix-server-mysql zabbix-web-mysql zabbix-agent mariadb
#创建zabbix库  //这里是用的远端数据库创建
MariaDB [(none)]> create database zabbix3 character set utf8 collate utf8_bin;
#创建用户
MariaDB [zabbix]> grant all on zabbix3.* to zabbix@'172.16.1.%' identified by '123';
#进入SQL文件目录
[root@web02 ~]# cd /usr/share/doc/zabbix-server-mysql-3.4.15/
#导入SQL文件
[root@web02 zabbix-server-mysql-3.4.15]# zcat create.sql.gz |mysql -uzabbix -p123 -h172.16.1.51 zabbix3
#编辑zabbix-server配置
[root@zabbix2 ~]# cat /etc/zabbix/zabbix_server.conf | grep '^DB'
DBHost=172.16.1.51
DBName=zabbix3
DBUser=zabbix
DBPassword=123
# 修改时区
vim /etc/httpd/conf.d/zabbix.conf
------------------------------------
php_value date.timezone Asia/Shanghai

#启动zabbix-server httpd并加入开机自启
systemctl start zabbix-server httpd zabbix-agent
systemctl enable zabbix-server httpd zabbix-agent
#浏览器访问
10.0.0.81/zabbix
后续安装步骤和5.0版本一样

