


环境准备:
| 主机名 | 外网IP | 内网IP | 角色 | 应用 |
|---|---|---|---|---|
| web01 | 10.0.0.7 | 172.16.1.7 | Elasticsearch | Elasticsearch-7.9 |
| web02 | 10.0.0.8 | 172.16.1.8 | Logstash | Logstash-7.9 |
| web03 | 10.0.0.9 | 172.16.1.9 | kafka | kafka-3.3.1 |
| kibana | 10.0.0.84 | 172.16.1.84 | kibana | kibana-7.9 |
ELK搭建部署
Elasticsearch-7.9安装
web01:10.0.0.7
#前决条件,安装jdk环境
vim es.install.sh
-----------------------------------------------------------------------------------------------------
#!/bin/bash
# 替换安装ip_name的变量
ip_name=10.0.0.7
mkdir -p /data/soft
cd /data/soft
wget  https://repo.huaweicloud.com/elasticsearch/7.9.1/elasticsearch-7.9.1-x86_64.rpm
rpm -ivh elasticsearch-7.9.1-x86_64.rpm
systemctl daemon-reload
systemctl enable elasticsearch
cat > /etc/elasticsearch/elasticsearch.yml << EOF
node.name: es01
path.data: /var/lib/elasticsearch
path.logs: /var/log/elasticsearch
bootstrap.memory_lock: true
network.host: 127.0.0.1,${ip_name}
http.port: 9200
discovery.seed_hosts: ["${ip_name}"]
cluster.initial_master_nodes: ["${ip_name}"]
EOF
sed -i '/\[Service\]/a LimitMEMLOCK=infinity' /usr/lib/systemd/system/elasticsearch.service
systemctl daemon-reload
systemctl start elasticsearch
----------------------------------------------------------------------------------------------------
Logstash-7.9
web02:10.0.0.8
#前决条件,安装jdk环境
#下载安装
[root@web02 ~]# wget https://repo.huaweicloud.com/logstash/7.9.1/logstash-7.9.1.rpm
[root@web02 ~]# rpm -ivh logstash-7.9.1.rpm
#测试安装是否成功
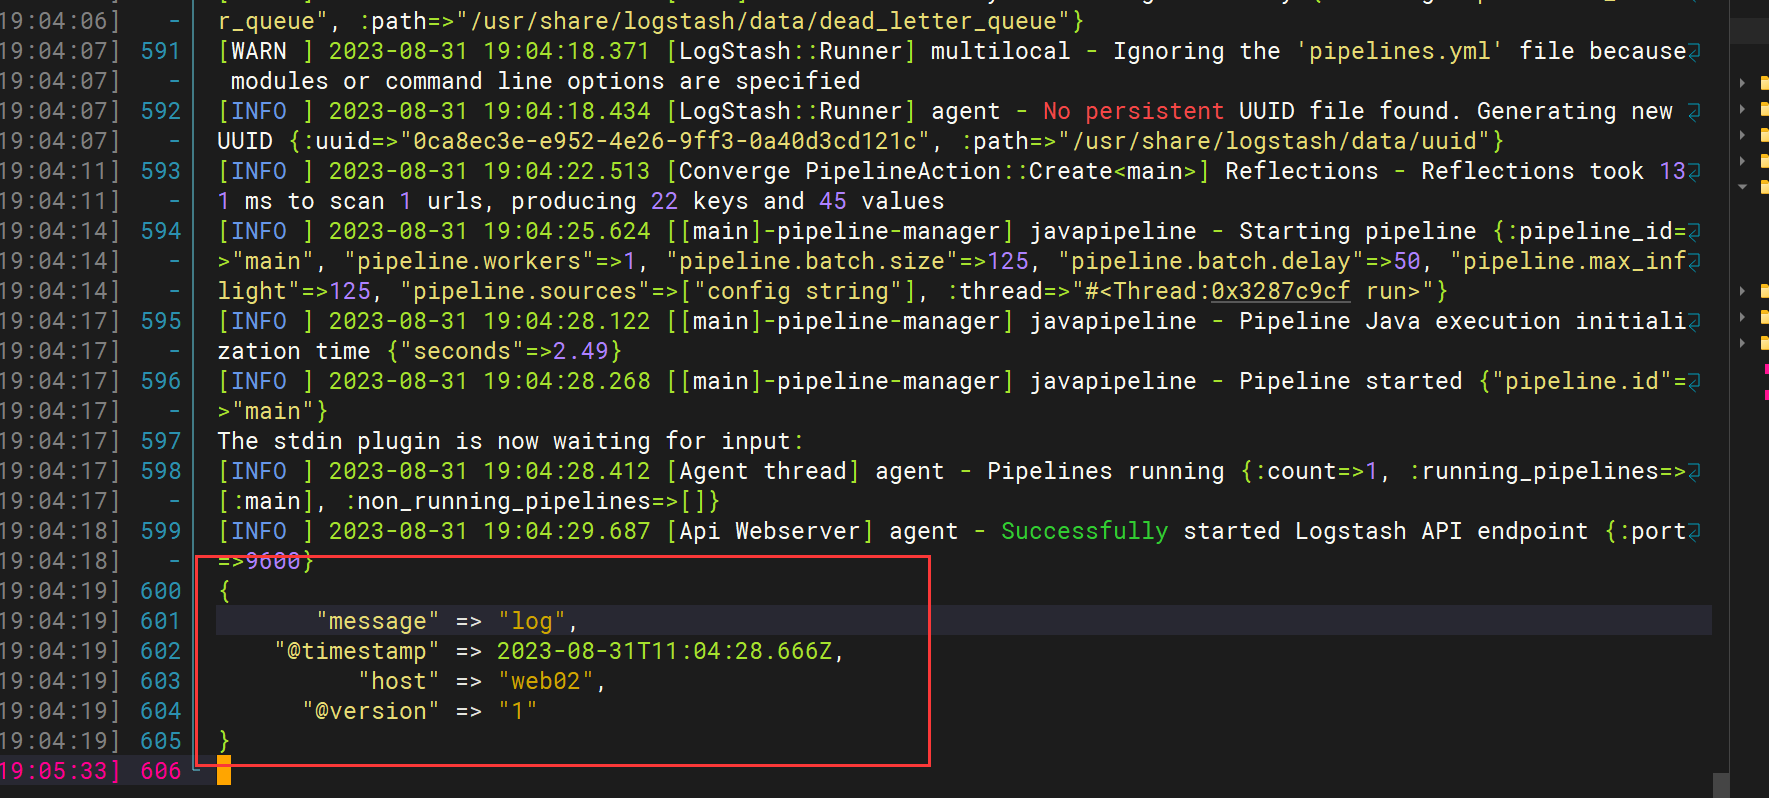
[root@web02 ~]# /usr/share/logstash/bin/logstash -e 'input { stdin{} } output { stdout{ codec => rubydebug }}'
OpenJDK 64-Bit Server VM warning: If the number of processors is expected to increase from one, then you should configure the number of parallel GC threads appropriately using -XX:ParallelGCThreads=N
log #//标准输入
{ #//标准输出
"@timestamp" => 2023-07-11T08:09:31.774Z,
"@version" => "1",
"host" => "logstash",
"message" => "log"
}
kibana-7.9
kibana:10.0.0.83
vim ki.install.sh
-----------------------------------------------------------------------------------------------------
#!/bin/bash
# 替换监控端口ip_name的变量
ip_name=10.0.0.7
wget  https://artifacts.elastic.co/downloads/kibana/kibana-7.9.1-x86_64.rpm
rpm -ivh kibana-7.9.1-x86_64.rpm
cat >> /etc/kibana/kibana.yml <<EOF
server.port: 5601
server.host: "0.0.0.0"
elasticsearch.hosts: ["http://${ip_name}:9200"]
kibana.index: ".kibana"
i18n.locale: "zh-CN"
EOF
systemctl start kibana
systemctl enable kibana
-----------------------------------------------------------------------------------------------------
Kafka安装部署
Kafka安装
#前决条件,安装jdk环境
#下载安装
[root@web03 ~]# wget https://mirrors.tuna.tsinghua.edu.cn/apache/kafka/3.4.1/kafka_2.13-3.4.1.tgz --no-check-certificate
#创建kafka安装目录
[root@web03 ~]# mkdir -p /data/server/kafka
#解压到安装目录
[root@web03 ~]# tar xf kafka_2.13-3.4.1.tgz -C /data/server/kafka/
#创建软链接
[root@web03 ~]# ln -s /data/server/kafka/kafka_2.13-3.4.1  /data/server/kafka/kafka
#配置环境变量
[root@web03 ~]# vim /etc/profile.d/kafka.sh
export KAFKA_HOME=/data/server/kafka
export PATH=$PATH:$KAFKA_HOME/bin
#环境生效
[root@web03 ~]# source /etc/profile
#创建zookeeper数据目录
[root@web03 ~]# mkdir -p /data/server/kafka/zookeeper
#创建zookeeper日志目录
[root@web03 ~]# mkdir -p /data/server/kafka/log/zookeeper
##进入kafka配置目录
[root@web03 ~]# cd /data/server/kafka/kafka/config
#备份
[root@web03 ~]# cp zookeeper.properties zookeeper.properties.bak
#编辑修改
[root@web03 ~]# vim zookeeper.properties
----------------------------------------------------------------------------------------------------
#zookeeper目录
dataDir=/data/server/kafka/zookeeper
#zookeeper日志目录
dataLogDir=/data/server/kafka/log/zookeeper
clientPort=2181
maxClientCnxns=10000
tickTime=2000
initLimit=10
syncLimit=5
#metricsProvider.exportJvmInfo=true
4lw.commands.whitelist=*
#添加zookeeper节点
#服务器名称与地址:集群信息(服务器编号,服务器地址,LF通信端口,选举端口)
server.1=10.0.0.9:2888:3888
-------------------------------------------------------------------------------------------------

#启动zookeeper(zookeeper要在kafka前启动)
[root@web03 ~]# cd /data/server/kafka/kafka/bin
# -daemon:以后台方式启动
[root@web03 ~]# ./zookeeper-server-start.sh -daemon ../config/zookeeper.properties
#查看进程
[root@web03 ~]# ps -ef |grep [z]ookeeper
#测试端口
[root@web03 ~]# telnet 10.0.0.9 2181
#配置kafka //备份
[root@web03 bin]# cp /data/server/kafka/kafka/config/server.properties /data/server/kafka/kafka/config/server.properties.bak
#修改kafka配置文件
[root@web03 bin]# vim /data/server/kafka/kafka/config/server.properties
-----------------------------------------------------------------------------------------------------
# 唯一标识在集群中的ID,每个节点的broker.id值唯一,1,2,3
broker.id=1
#broker 服务器要监听的地址及端口,默认监听端口9092
listeners=PLAINTEXT://0.0.0.0:9092
#处理网络请求的最大线程数
num.network.threads=3
#处理I/O请求的线程数
num.io.threads=8
#暴露对外访问的地址 这个是对外提供的地址 , 当client请求到kafka时, 会分发这个地址
advertised.listeners=PLAINTEXT://10.0.0.9:9092
log.dirs=/data/server/kafka/kafka-logs
zookeeper.connect=10.0.0.9:2181
#允许通过kafka命令行就可以直接删除topic
delete.topic.enable=true
#关闭自动创建topic
auto.create.topics.enable=false
#默认日志保留时间7天(168小时)
log.retention.hours=7
---------------------------------------------------------------------------------------------------
#启动kafka
[root@web03 bin]# cd /data/server/kafka/kafka/bin
# -daemon:以后台方式启动
[root@web03 bin]# ./kafka-server-start.sh -daemon ../config/server.properties
#查看进程
[root@web03 ~]# ps -ef |grep [k]afka
Kafka测试消息生产与消费
#首先创建一个主题
命令如下:
[root@web03 bin]# ./kafka-topics.sh --bootstrap-server localhost:9092 --create --topic test_kafka --partitions 2 --replication-factor 1
OpenJDK 64-Bit Server VM warning: If the number of processors is expected to increase from one, then you should configure the number of parallel GC threads appropriately using -XX:ParallelGCThreads=N
WARNING: Due to limitations in metric names, topics with a period ('.') or underscore ('_') could collide. To avoid issues it is best to use either, but not both.
Created topic test_kafka. #//创建成功
#命令解读
--bootstrap-server:指定了Kafka所连接的Zookeeper服务地址
--create:创建主题的动作指令
--topic:指定了所要创建主题的名称
--partitions:指定了分区个数
--replication-factor:指定了副本因子
#展示所有主题
命令:
[root@web03 bin]# ./kafka-topics.sh --bootstrap-server localhost:9092 --list
OpenJDK 64-Bit Server VM warning: If the number of processors is expected to increase from one, then you should configure the number of parallel GC threads appropriately using -XX:ParallelGCThreads=N
test_kafka #//主题名称
#查看主题详情
命令:
[root@web03 bin]# ./kafka-topics.sh --bootstrap-server localhost:9092 --describe --topic test_kafka
OpenJDK 64-Bit Server VM warning: If the number of processors is expected to increase from one, then you should configure the number of parallel GC threads appropriately using -XX:ParallelGCThreads=N
Topic: test_kafka TopicId: VRgw_24STaqQWILE3P6xew PartitionCount: 2 ReplicationFactor: 1 Configs:
Topic: test_kafka Partition: 0 Leader: 1 Replicas: 1 Isr: 1
Topic: test_kafka Partition: 1 Leader: 1 Replicas: 1 Isr: 1
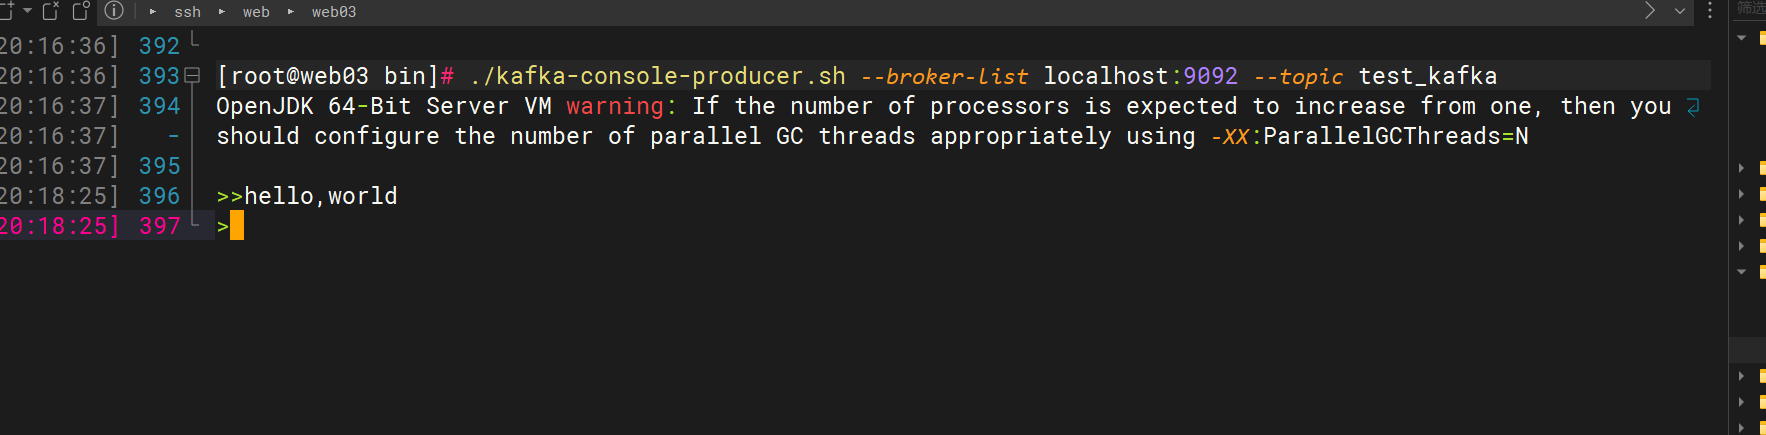
#生产测试 //另起一个终端
[root@web03 bin]# /data/server/kafka/kafka/bin/kafka-console-producer.sh --broker-list localhost:9092 --topic test_kafka
OpenJDK 64-Bit Server VM warning: If the number of processors is expected to increase from one, then you should configure the number of parallel GC threads appropriately using -XX:ParallelGCThreads=N
>>hello,world #//生产测试
>
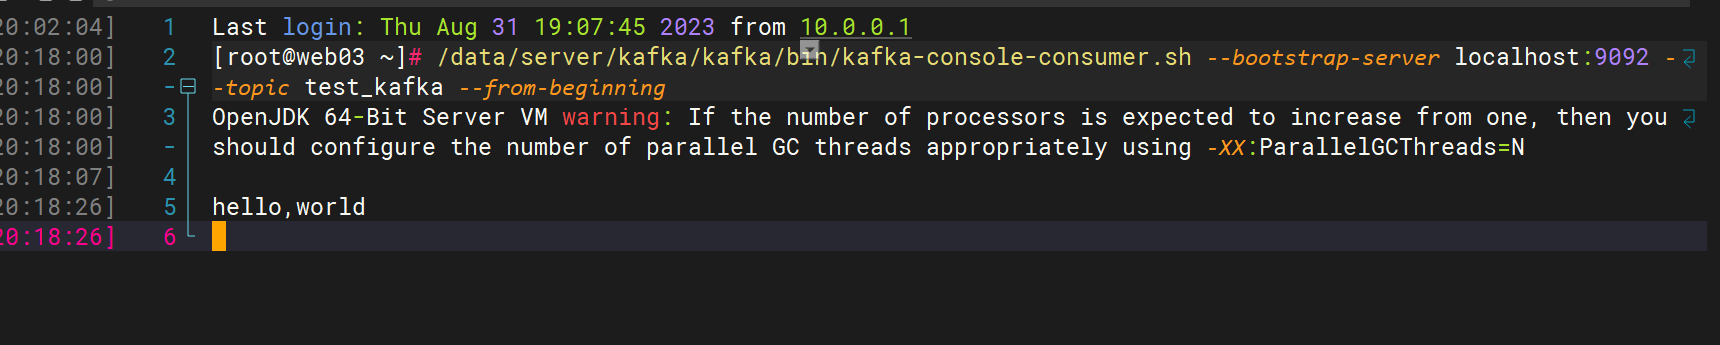
#消费测试
[root@web03 ~]# /data/server/kafka/kafka/bin/kafka-console-consumer.sh --bootstrap-server localhost:9092 --topic test_kafka --from-beginning
OpenJDK 64-Bit Server VM warning: If the number of processors is expected to increase from one, then you should configure the number of parallel GC threads appropriately using -XX:ParallelGCThreads=N
hello,world #//消费测试
以上是Kafka生产者和消费者的测试,基于Kafka的Zookeeper集群就成功了
ELK收集日志结合Kafka
流程:logstash收集 ---> kafka --------> logstash拿取kafka日志 ----->Elasticsearch
收集消息至Kafka
下面我们将ES Server:10.0.0.8上面的logstash的输出改到kafka上面,将数据写入到kafka中
创建LogStash结合Kafka使用的.conf文件,注意文件目录
修改logstash的输出从标准输出改到kafka中,修改配置文件
# 编辑logstash配置文件 //采集
[root@elk03 ~]# vim /etc/logstash/conf.d/log.conf
input{
file{
type => 'systemctl_log'
path => '/var/log/messages'
start_position => 'end'
}
}
output {
kafka {
bootstrap_servers => "10.0.0.9:9092"
topic_id => "test_kafka"
}
}
#启动服务
[root@web02 ~]# /usr/share/logstash/bin/logstash -f /etc/logstash/conf.d/log.conf
#生产日志消息 //重启任意服务即可
[root@web02 ~]# systemctl restart nginx
[root@web02 ~]# systemctl restart nginx
[root@web02 ~]#
[root@web02 ~]#
[root@web02 ~]# systemctl restart nginx
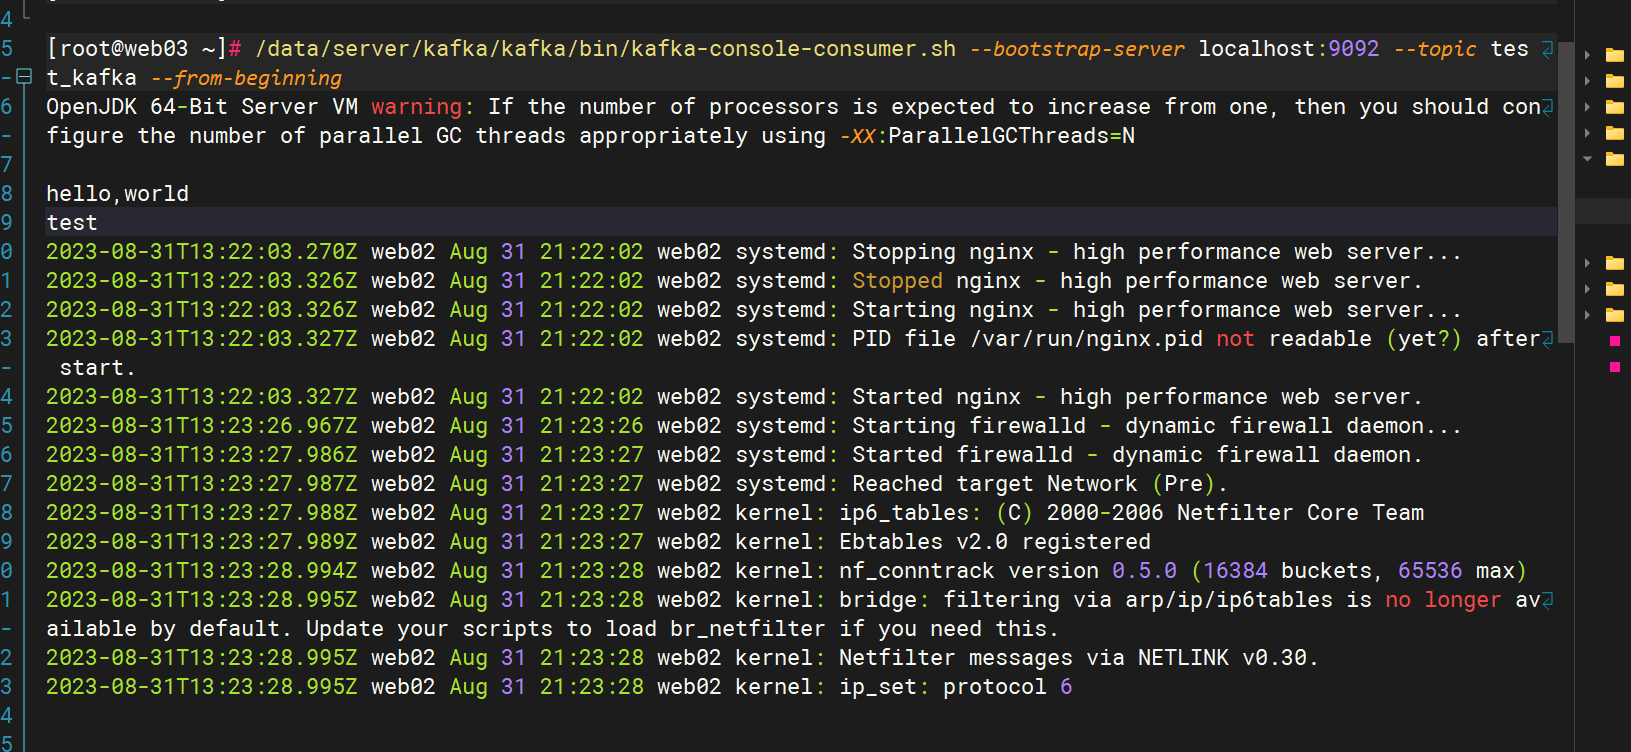
# 查看kafka
[root@web03 ~]# /data/server/kafka/kafka/bin/kafka-console-consumer.sh --bootstrap-server localhost:9092 --topic test_kafka --from-beginning
OpenJDK 64-Bit Server VM warning: If the number of processors is expected to increase from one, then you should configure the number of parallel GC threads appropriately using -XX:ParallelGCThreads=N
hello,world
test
2023-08-31T13:22:03.270Z web02 Aug 31 21:22:02 web02 systemd: Stopping nginx - high performance web server...
2023-08-31T13:22:03.326Z web02 Aug 31 21:22:02 web02 systemd: Stopped nginx - high performance web server.
2023-08-31T13:22:03.326Z web02 Aug 31 21:22:02 web02 systemd: Starting nginx - high performance web server...
2023-08-31T13:22:03.327Z web02 Aug 31 21:22:02 web02 systemd: PID file /var/run/nginx.pid not readable (yet?) after start.
2023-08-31T13:22:03.327Z web02 Aug 31 21:22:02 web02 systemd: Started nginx - high performance web server.
kafka消息收集至Es
kafka安装logstash
#下载安装
[root@web02 ~]# wget https://repo.huaweicloud.com/logstash/7.9.1/logstash-7.9.1.rpm
[root@web02 ~]# rpm -ivh logstash-7.9.1.rpm
#测试安装是否成功
[root@web02 ~]# /usr/share/logstash/bin/logstash -e 'input { stdin{} } output { stdout{ codec => rubydebug }}'
OpenJDK 64-Bit Server VM warning: If the number of processors is expected to increase from one, then you should configure the number of parallel GC threads appropriately using -XX:ParallelGCThreads=N
log    #//标准输入
{       #//标准输出
    "@timestamp" => 2023-07-11T08:09:31.774Z,
      "@version" => "1",
          "host" => "logstash",
       "message" => "log"
}
# 编辑logstash配置文件 //采集
[root@elk03 ~]# vim /etc/logstash/conf.d/log.conf
input {
  kafka {
    type  => "test"
    bootstrap_servers => "127.0.0.1:9092"
    topics => ["test_kafka"]
  }
}

output {
    elasticsearch {
      hosts => ["10.0.0.7:9200"]
      index => "%{type}-%{+yyyy.MM.dd}"
    }
}

[root@logstash ~]# /usr/share/logstash/bin/logstash -f /etc/logstash/conf.d/log.conf
#Elasticsearch查看从kafka收集的日志信息
cat /var/lib/elasticsearch/nodes/0/indices/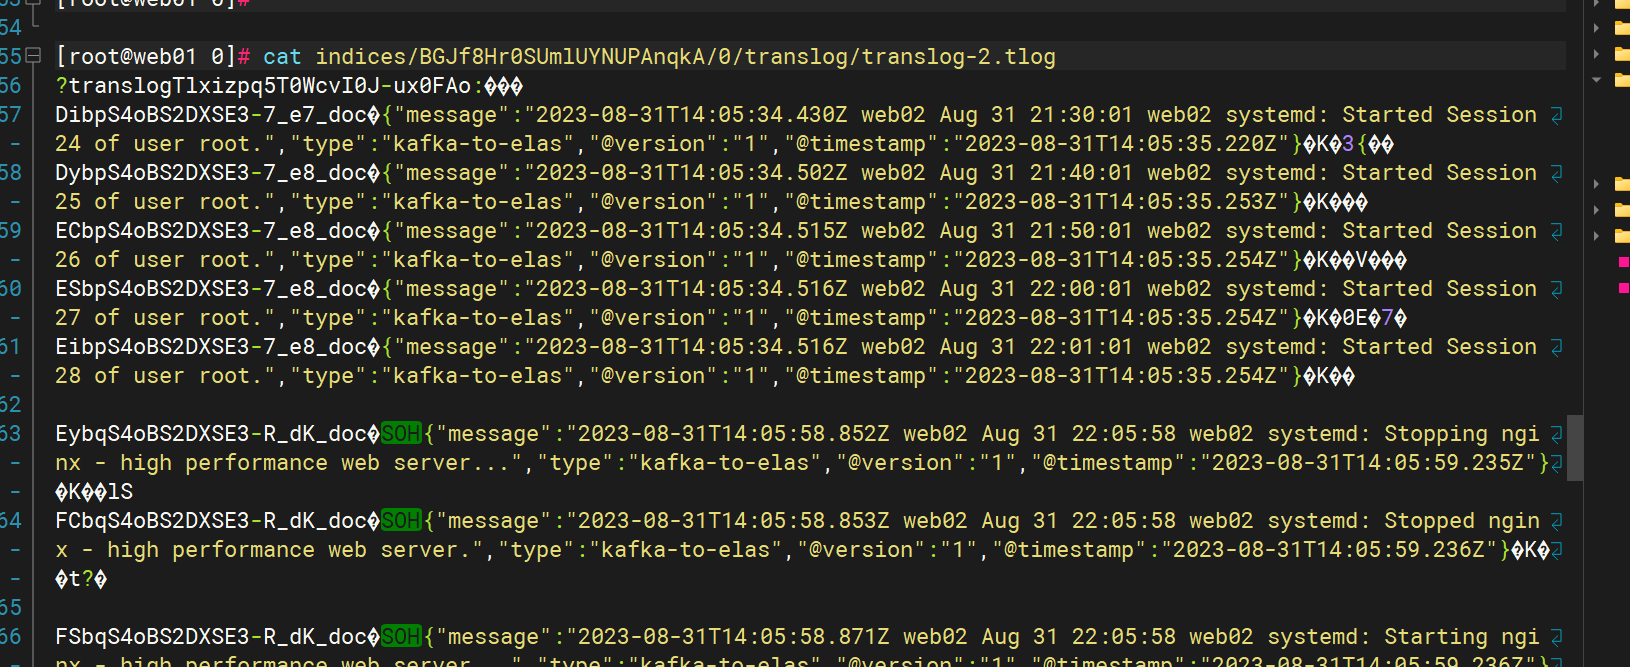
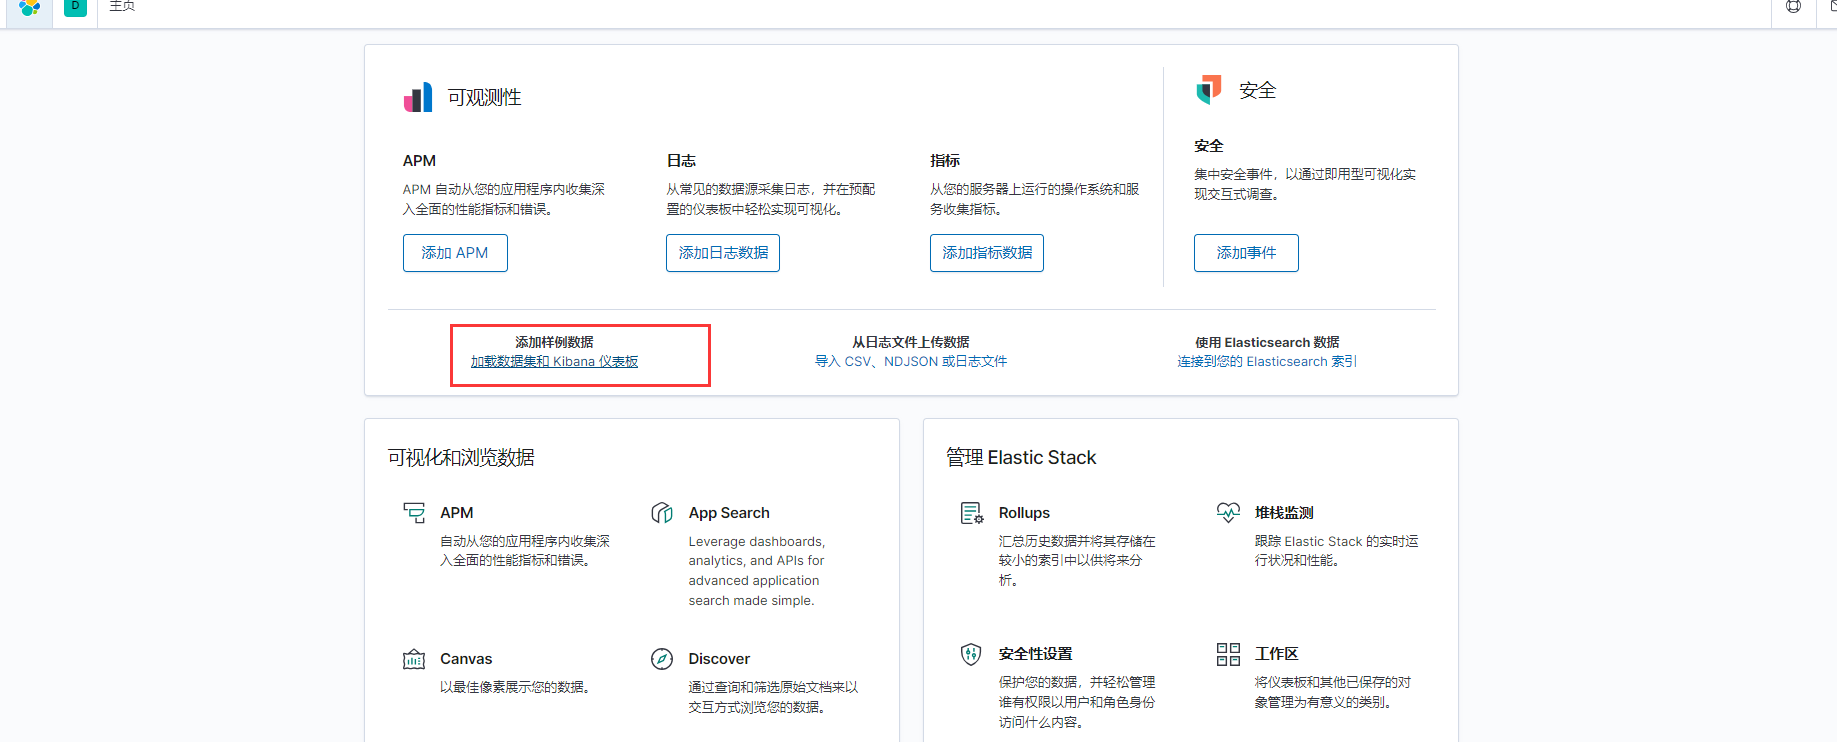
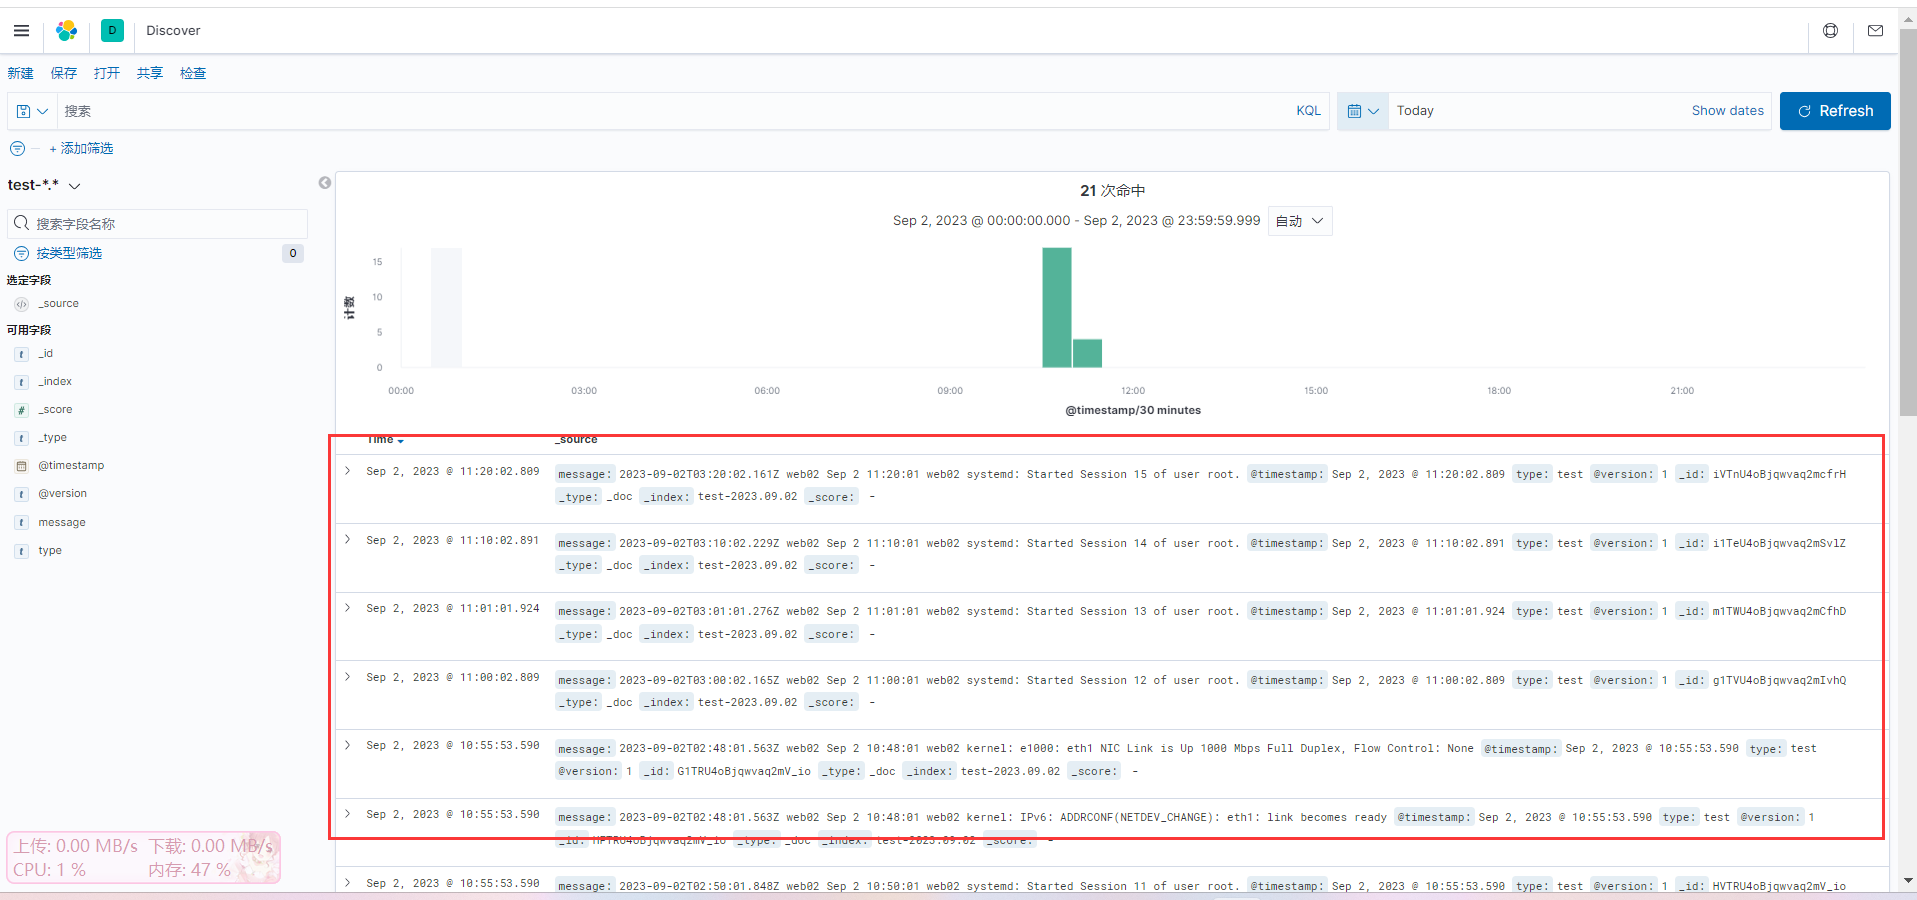
Kibana可视化收集查看
#网页访问kibana
10.0.0.84:5601
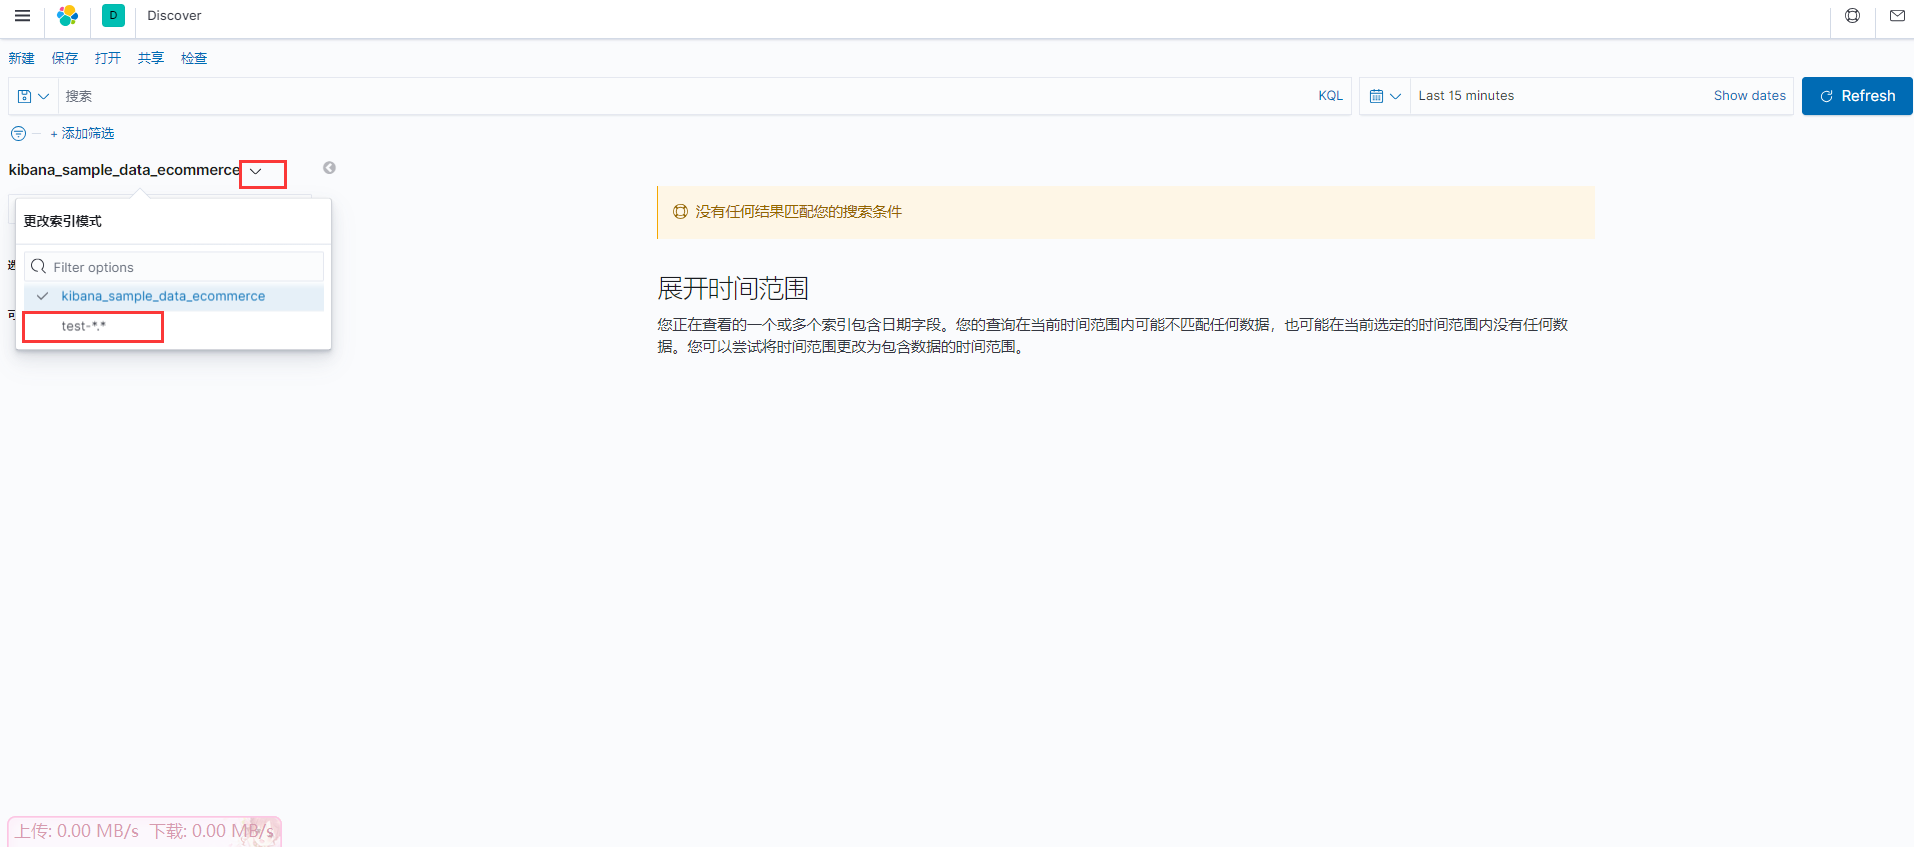
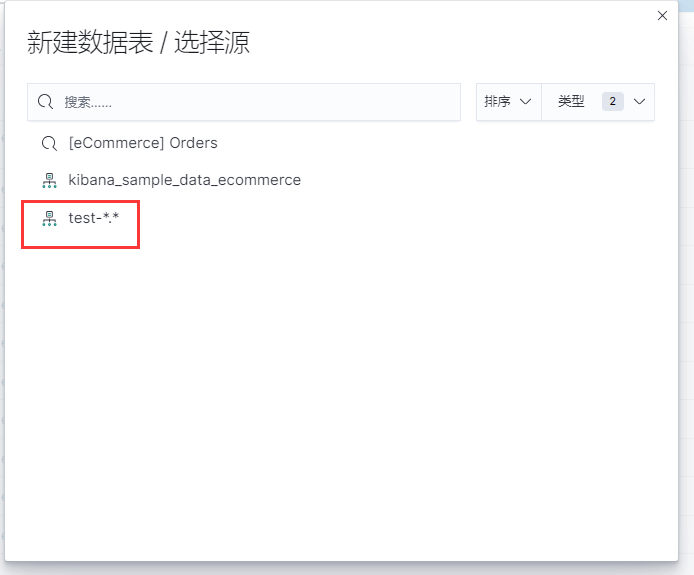
创建索引:
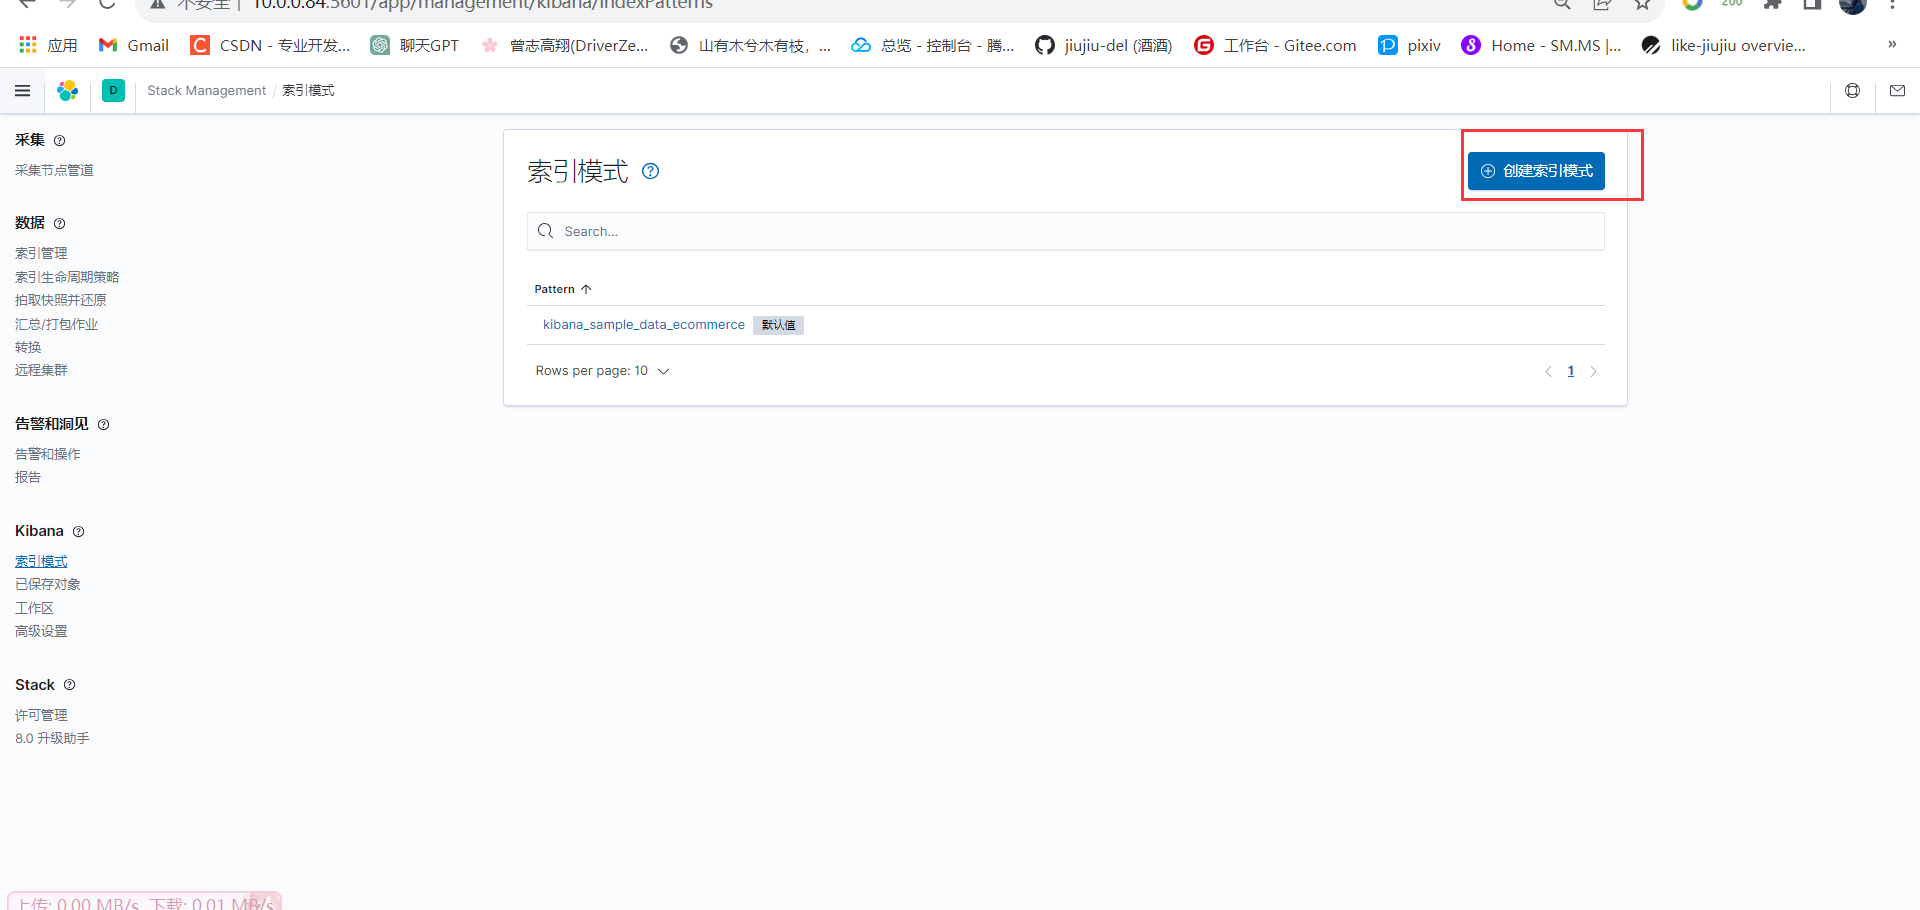
注意:索引匹配规则!!!
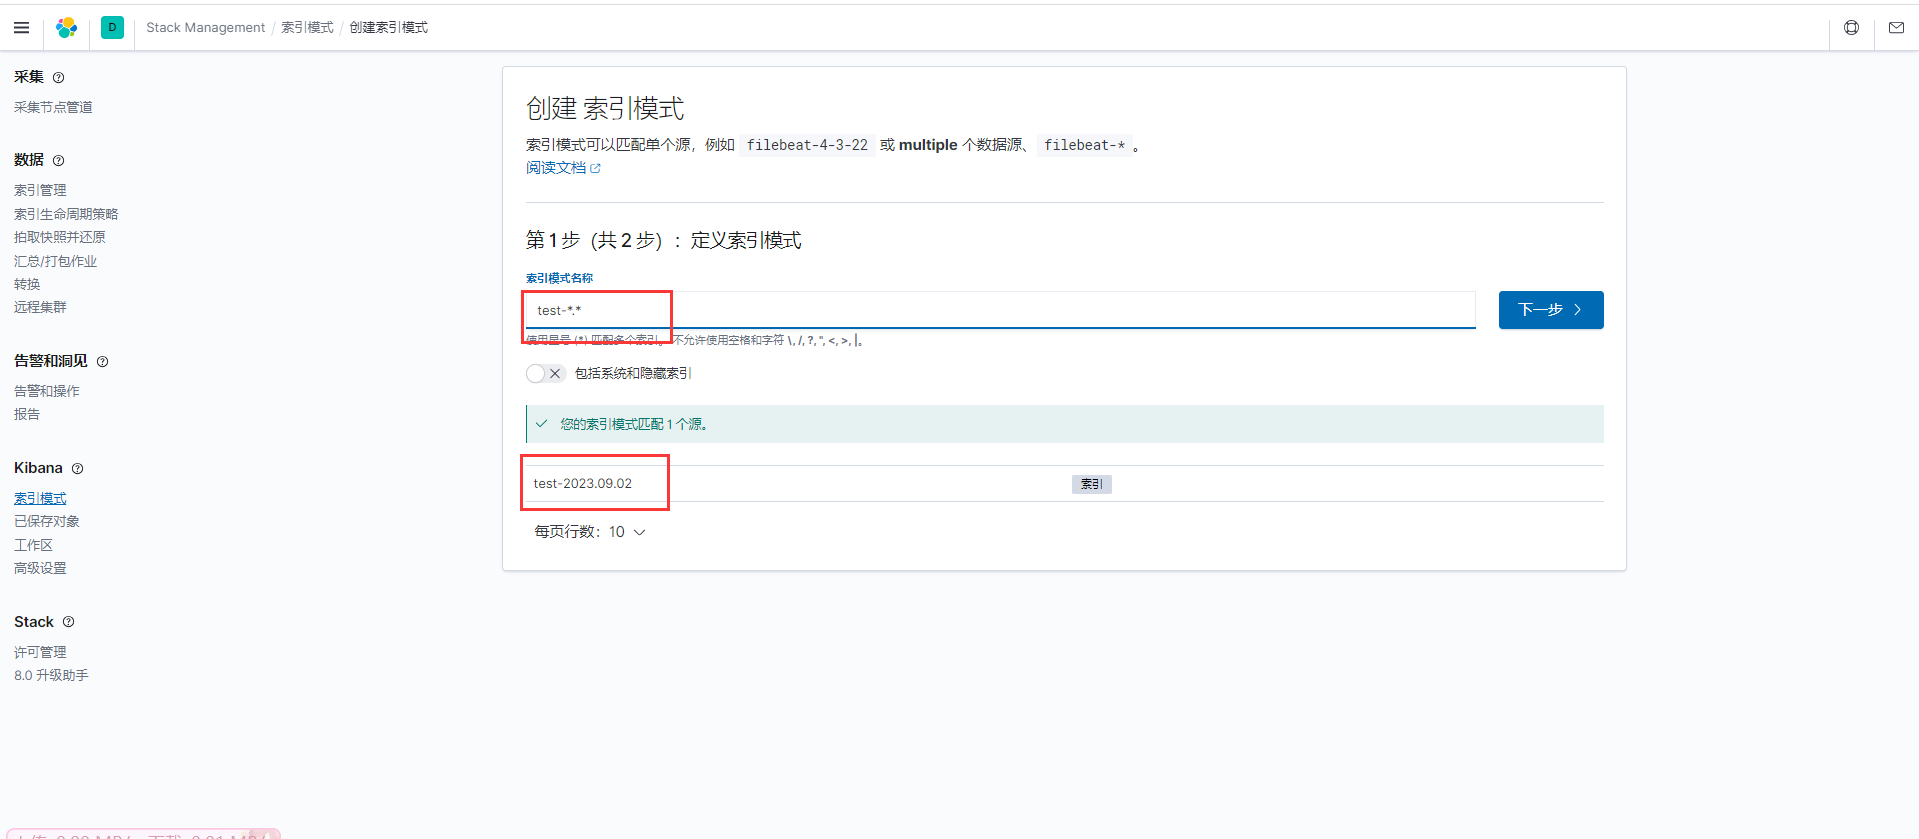
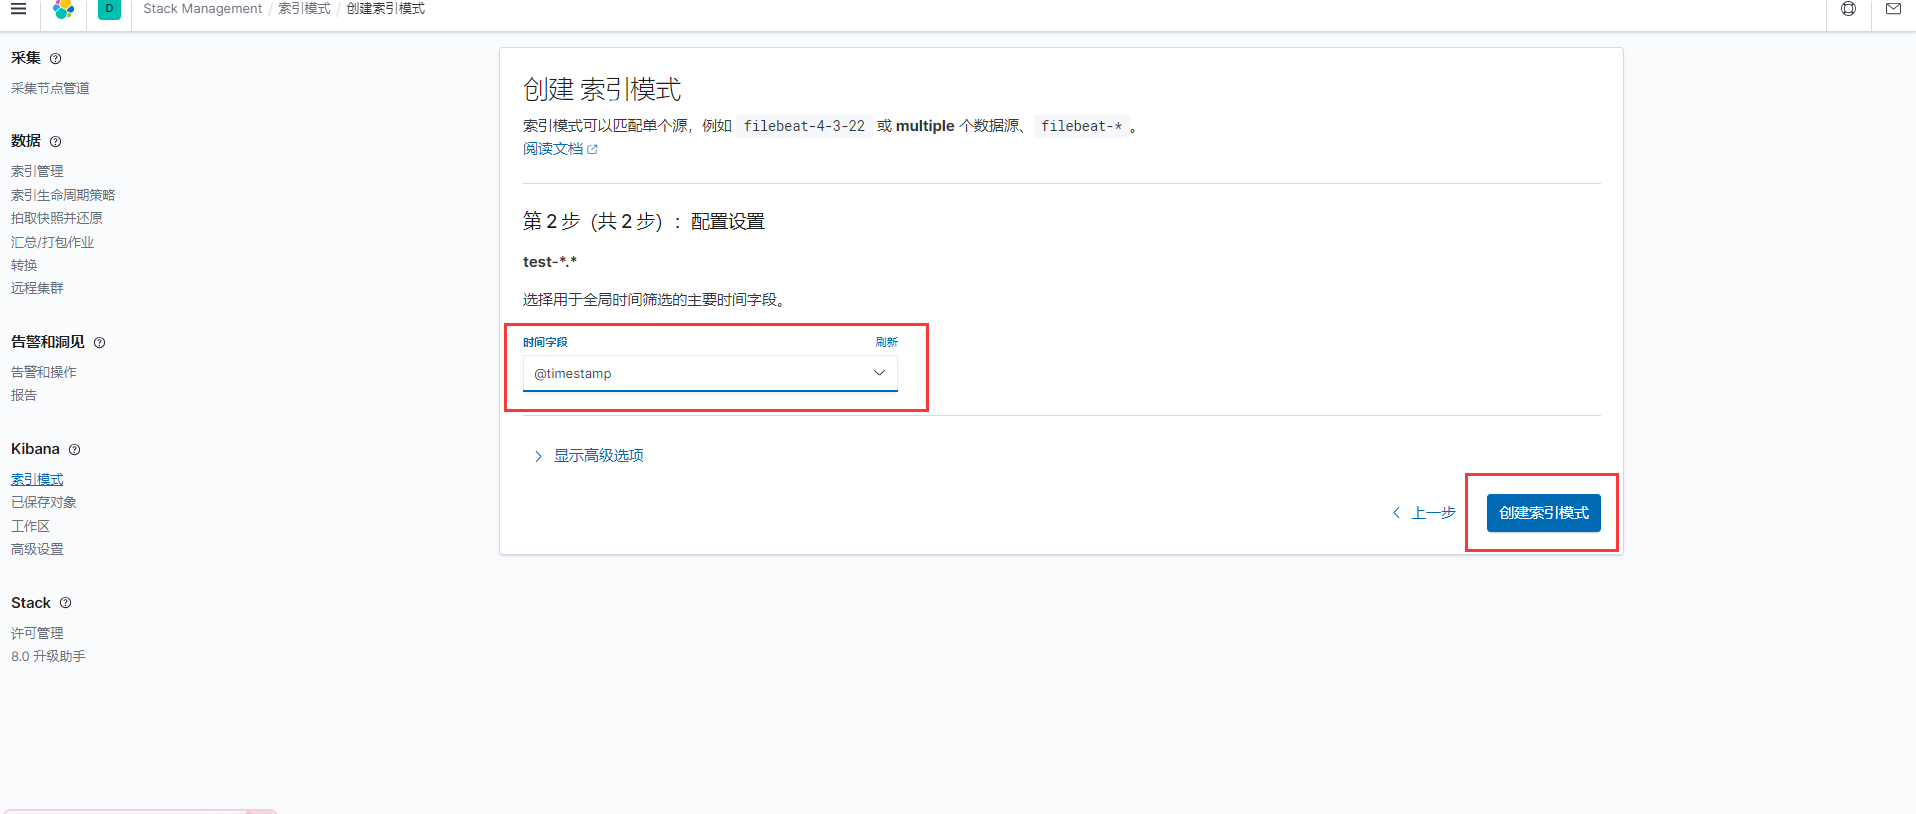
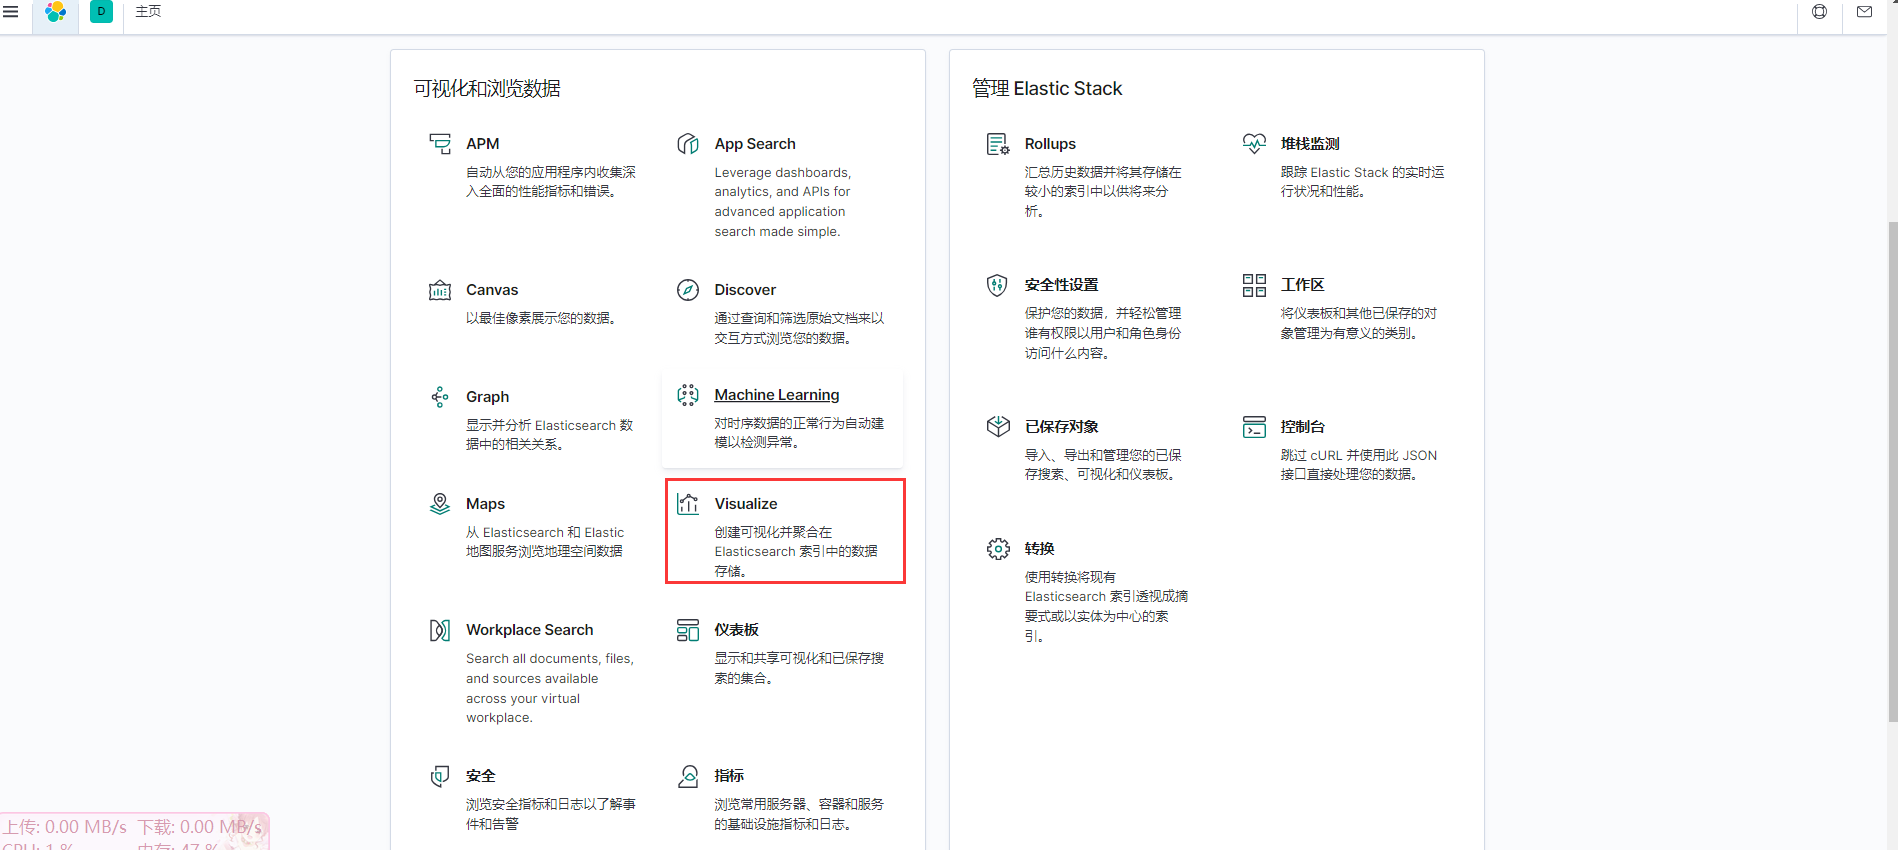
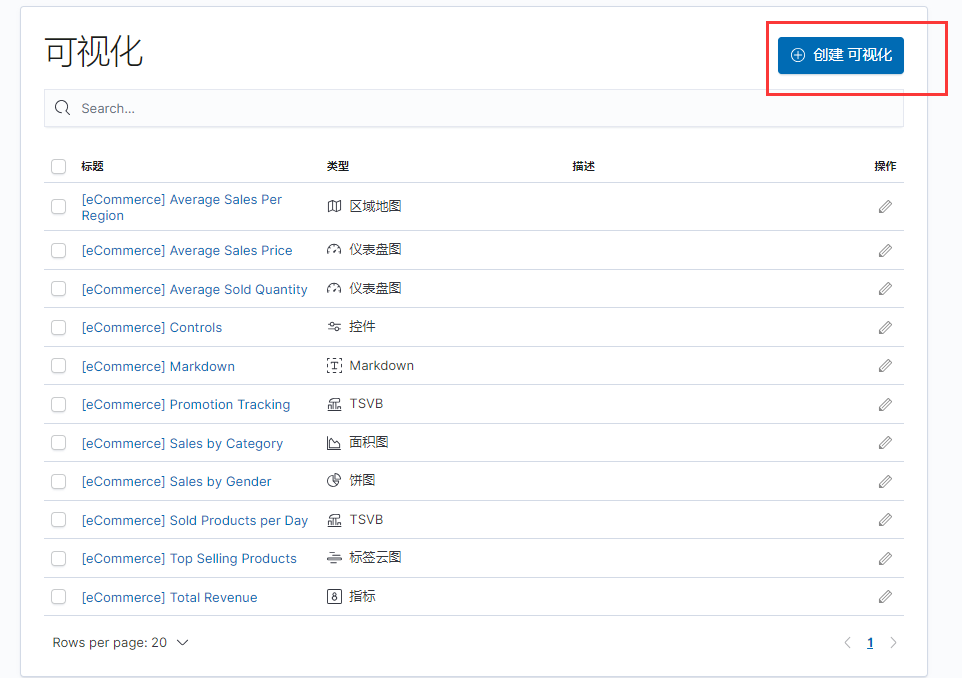
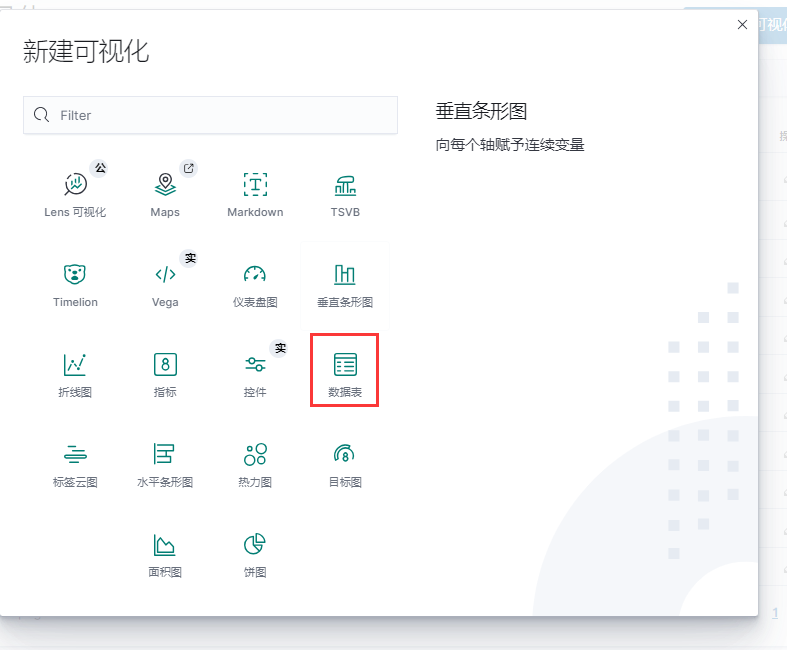
创建可视化:
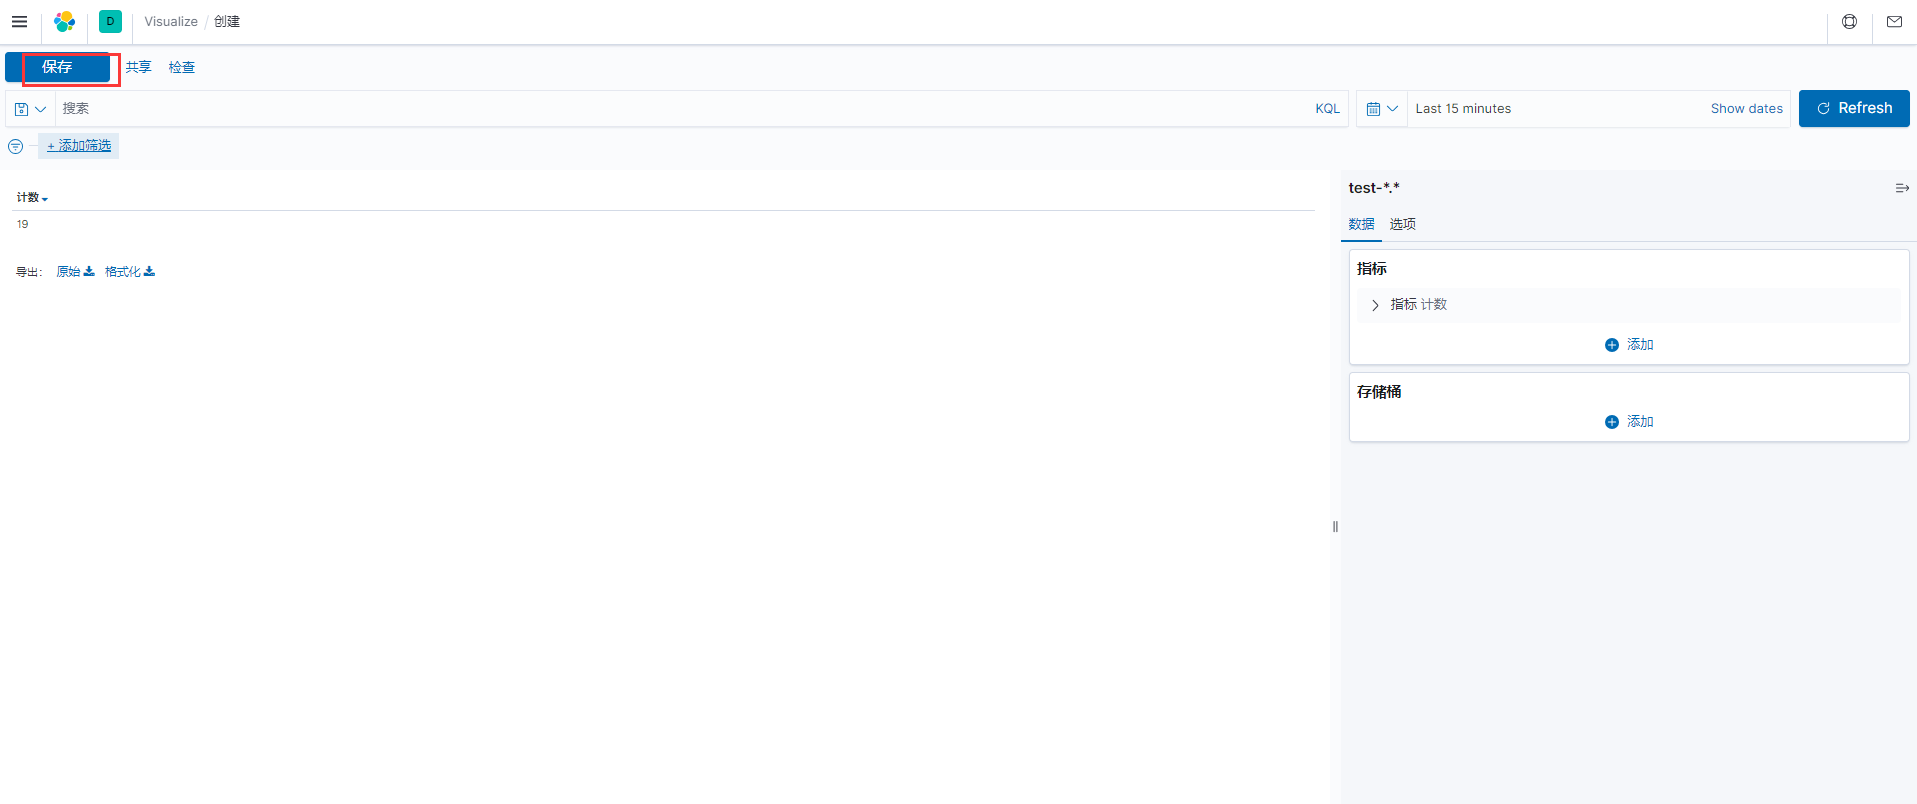
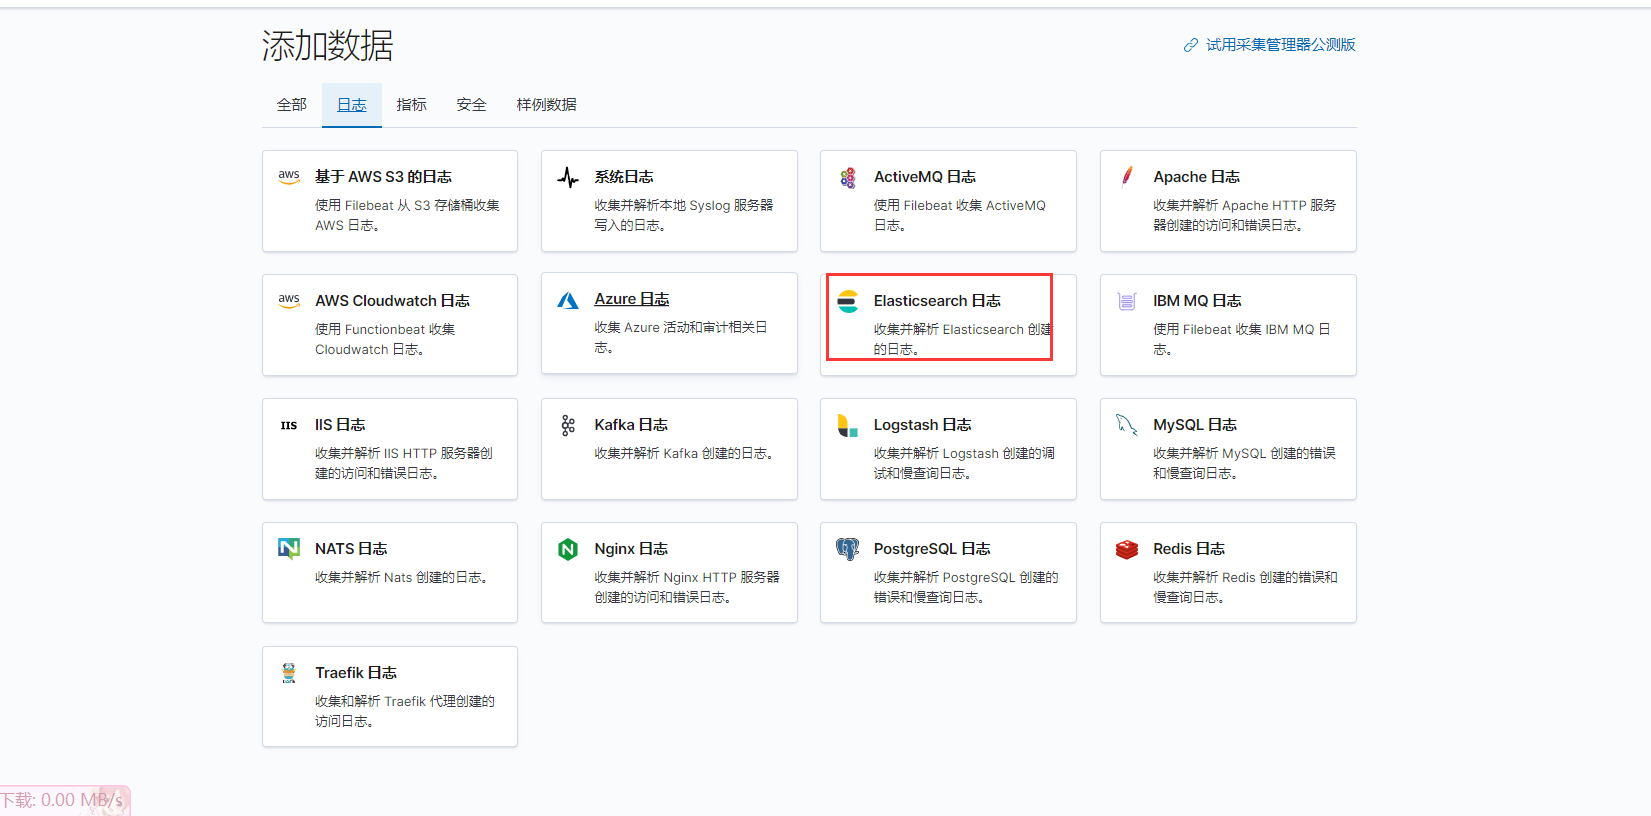
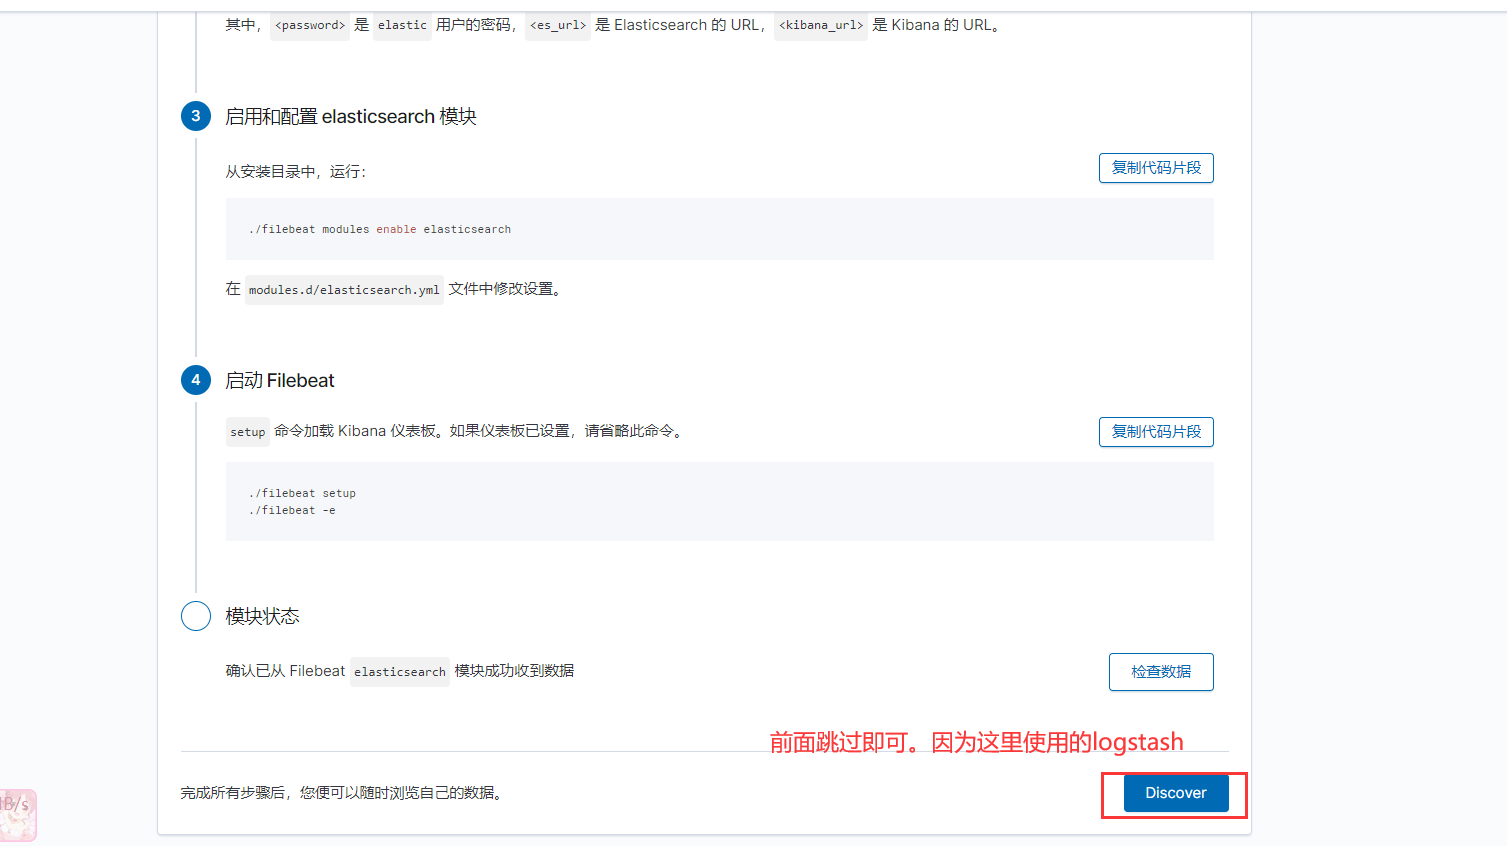
添加样例数据: