


Logstash部署
Logstash是一个开源的数据收集引擎,可以水平伸缩,而且logstash整个ELK当中拥有最多插件的一个组
件,其可以接收来自不同来源的数据并统一输出到指定的且可以是多个不同目的地。
环境准备:
| 主机 | 外网IP | 内网IP | 角色 | 应用 |
|---|---|---|---|---|
| logstash | 10.0.0.83 | 172.16.1.83 | 收集日志信息 | JDK、logstash |
#下载安装JDk
[root@logstash ~]# yum install -y java
#安装logstash
[root@logstash ~]# yum localinstall logstash-5.3.0.rpm -y
# 授权
[root@logstash ~]# chown logstash.logstash /usr/share/logstash/
logstash的插件
INPUT :输入插件 日志来自哪里
OUPUT :输出插件
| INPUT支持事件源 | OUTPUT支持输出源 | CODEC编解码器支持编码 |
|---|---|---|
| azure_event_hubs(微软云事件中心) | elasticsearch(搜索引擎数据库) | avro(数据序列化) |
| beats(filebeat日志收集工具) | email(邮件) | CEF(嵌入式框架) |
| elasticsearch(搜索引擎数据库) | file(文件) | es_bulk(ES中的bulk api) |
| file(文件) | http(超文本传输协议) | Json(数据序列化、格式化) |
| generator(生成器) | kafka(基于java的消息队列) | Json_lines(便于存储结构化) |
| heartbeat(高可用软件) | rabbitmq(消息队列 OpenStack) | line(行) |
| http_poller(http api) | redis(缓存、消息队列、NoSQL) | multiline(多行匹配) |
| jdbc(java连接数据库的驱动) | s3*(存储) | plain(纯文本,事件间无间隔) |
| kafka(基于java的消息队列) | stdout(标准输出) | rubydebug(ruby语法格式) |
| rabbitmq(消息队列 OpenStack) | tcp(传输控制协议) | |
| redis(缓存、消息队列、NoSQL) | udp(用户数据报协议) | |
| s3*(存储) | ||
| stdin(标准输入) | ||
| syslog(系统日志) | ||
| tcp(传输控制协议) | ||
| udp(用户数据报协议) |
测试标准输入和输出
标准输入 再终端打的字
标准输出 终端显示的字
[root@logstash ~]# /usr/share/logstash/bin/logstash -e 'input { stdin{} } output { stdout{ codec => rubydebug }}'
OpenJDK 64-Bit Server VM warning: If the number of processors is expected to increase from one, then you should configure the number of parallel GC threads appropriately using -XX:ParallelGCThreads=N
log    #//标准输入
{       #//标准输出
    "@timestamp" => 2023-07-11T08:09:31.774Z,
      "@version" => "1",
          "host" => "logstash",
       "message" => "log"
}
测试logstash标准输入到文件
#标准输入
[root@logstash ~]# /usr/share/logstash/bin/logstash -e 'input { stdin{} } output { file { path =>"/tmp/test_%{+YYYY.MM.dd}.log"}}'
log_nginx
# 检测文件内容
[root@logstash ~]# cat /tmp/test_2023.07.11.log
{"@timestamp":"2023-07-11T08:13:22.105Z","@version":"1","host":"logstash","message":"log_nginx"}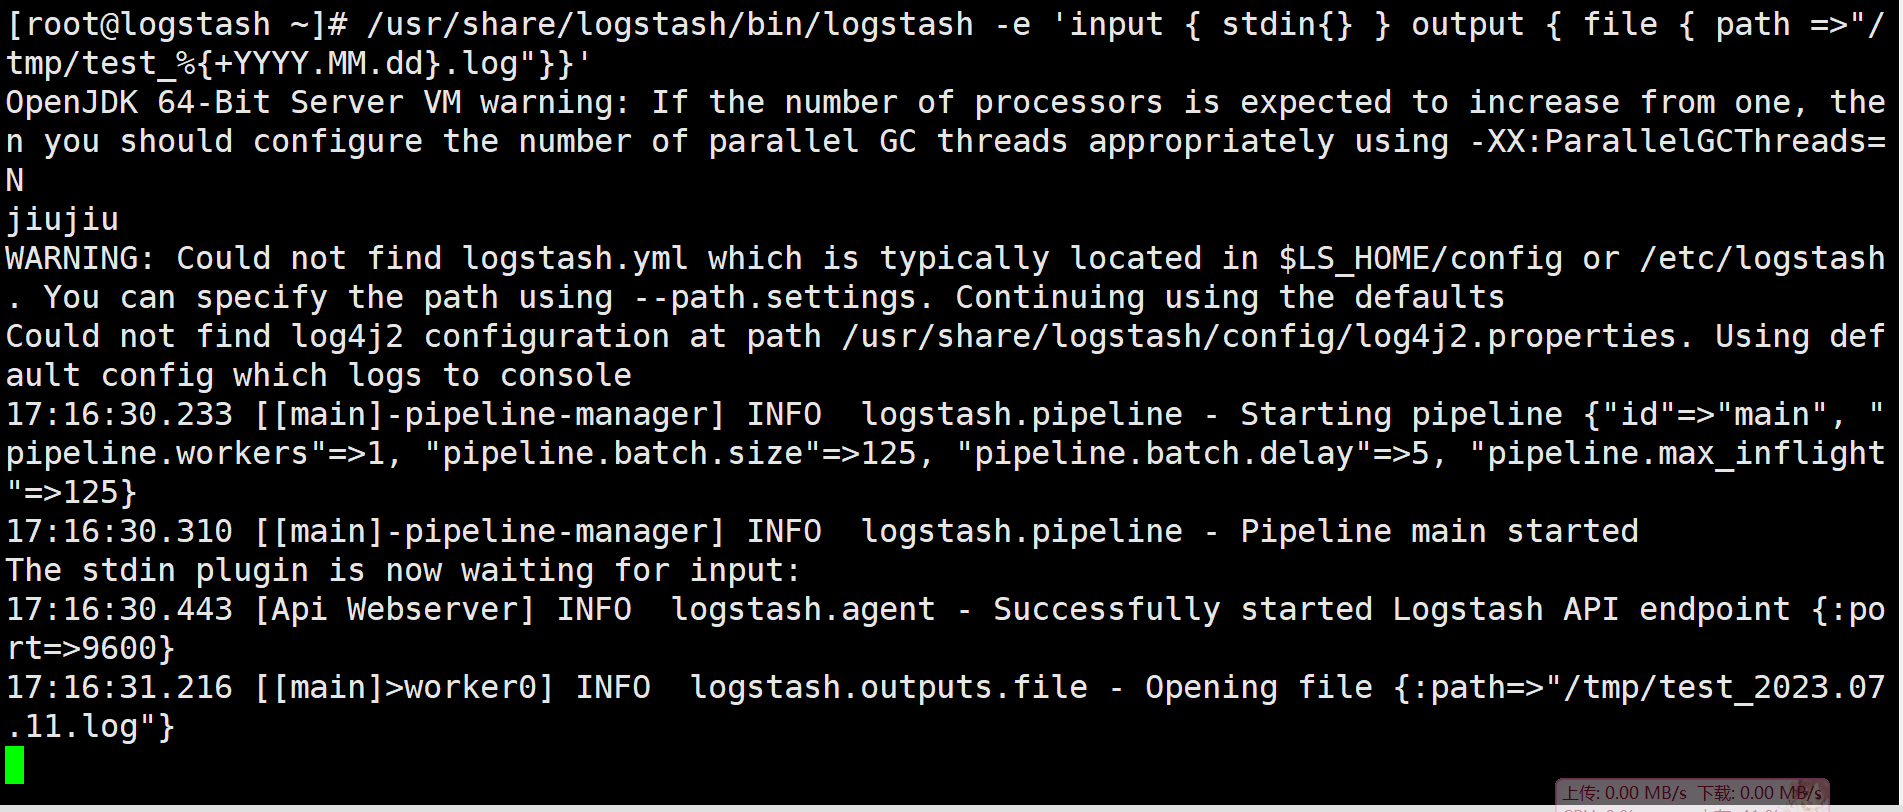
测试标准输出到ES
#从标准输入到Elasticsearch
[root@logstash ~]# /usr/share/logstash/bin/logstash -e 'input { stdin{} } output { elasticsearch{hosts => ["10.0.0.81:9200"] index => "jiujiu_%{+YYYY.MM.dd}" }}'
#输入内容
log_nginx
#在Elasticsearch中查看数据结果
[root@logstash ~]# ll /data/es/data/nodes/0/indices/
total 0
drwxr-xr-x 8 elasticsearch elasticsearch 65 Jul 11 17:13 7QNEqxkpRka426mYEHxUXg
drwxr-xr-x 8 elasticsearch elasticsearch 65 Jul 11 17:18 RuixzjfORqG6pS8dBAIwUg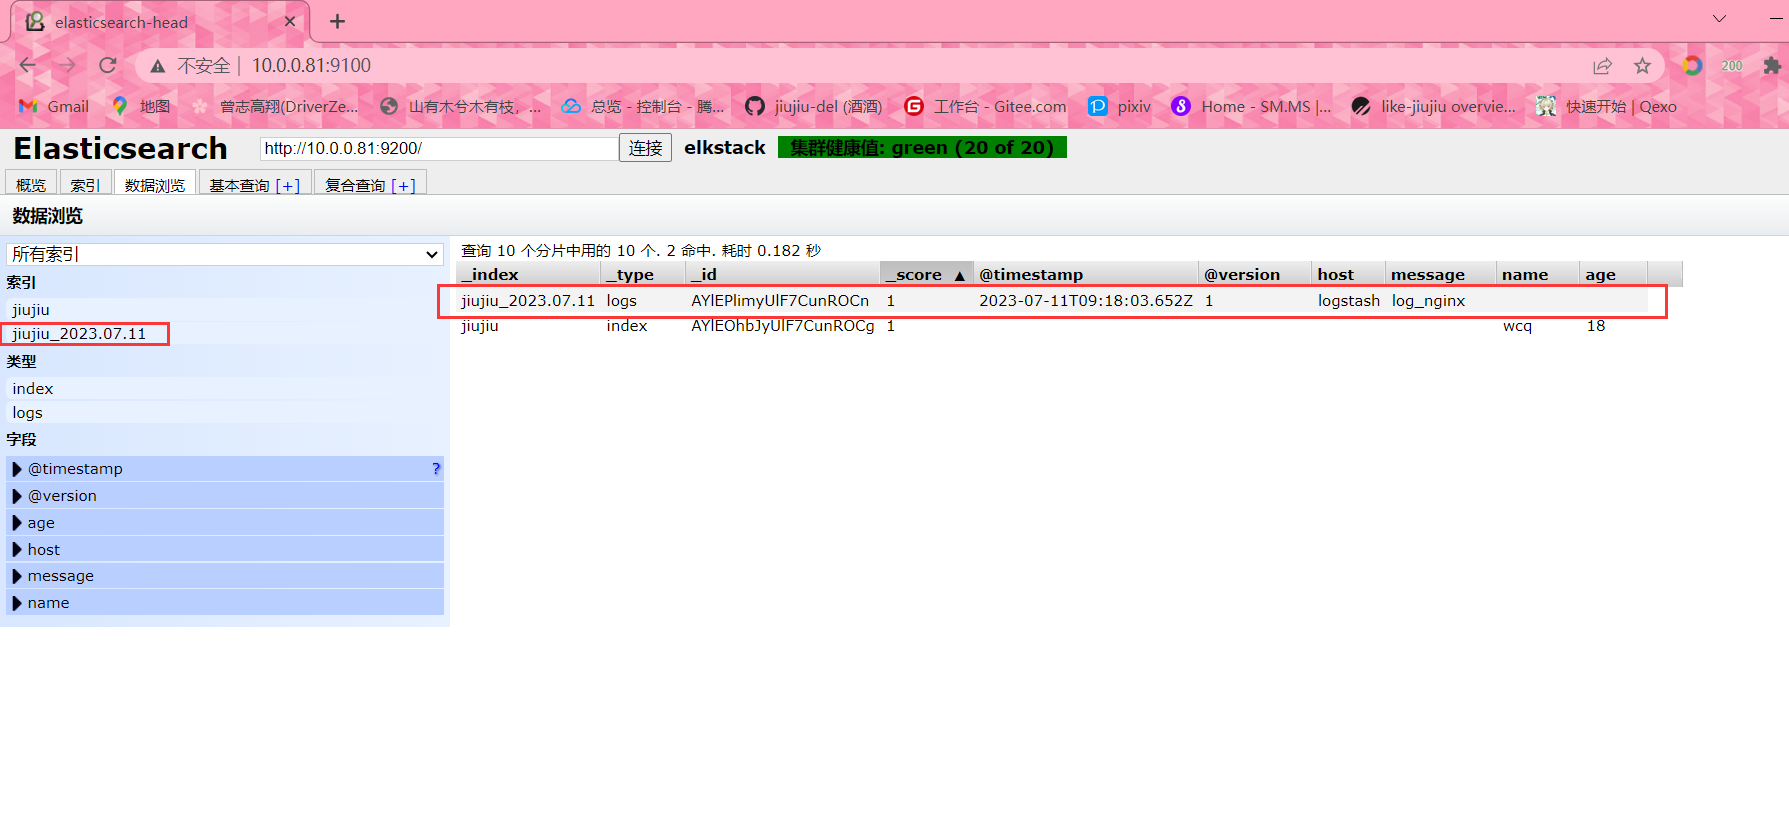
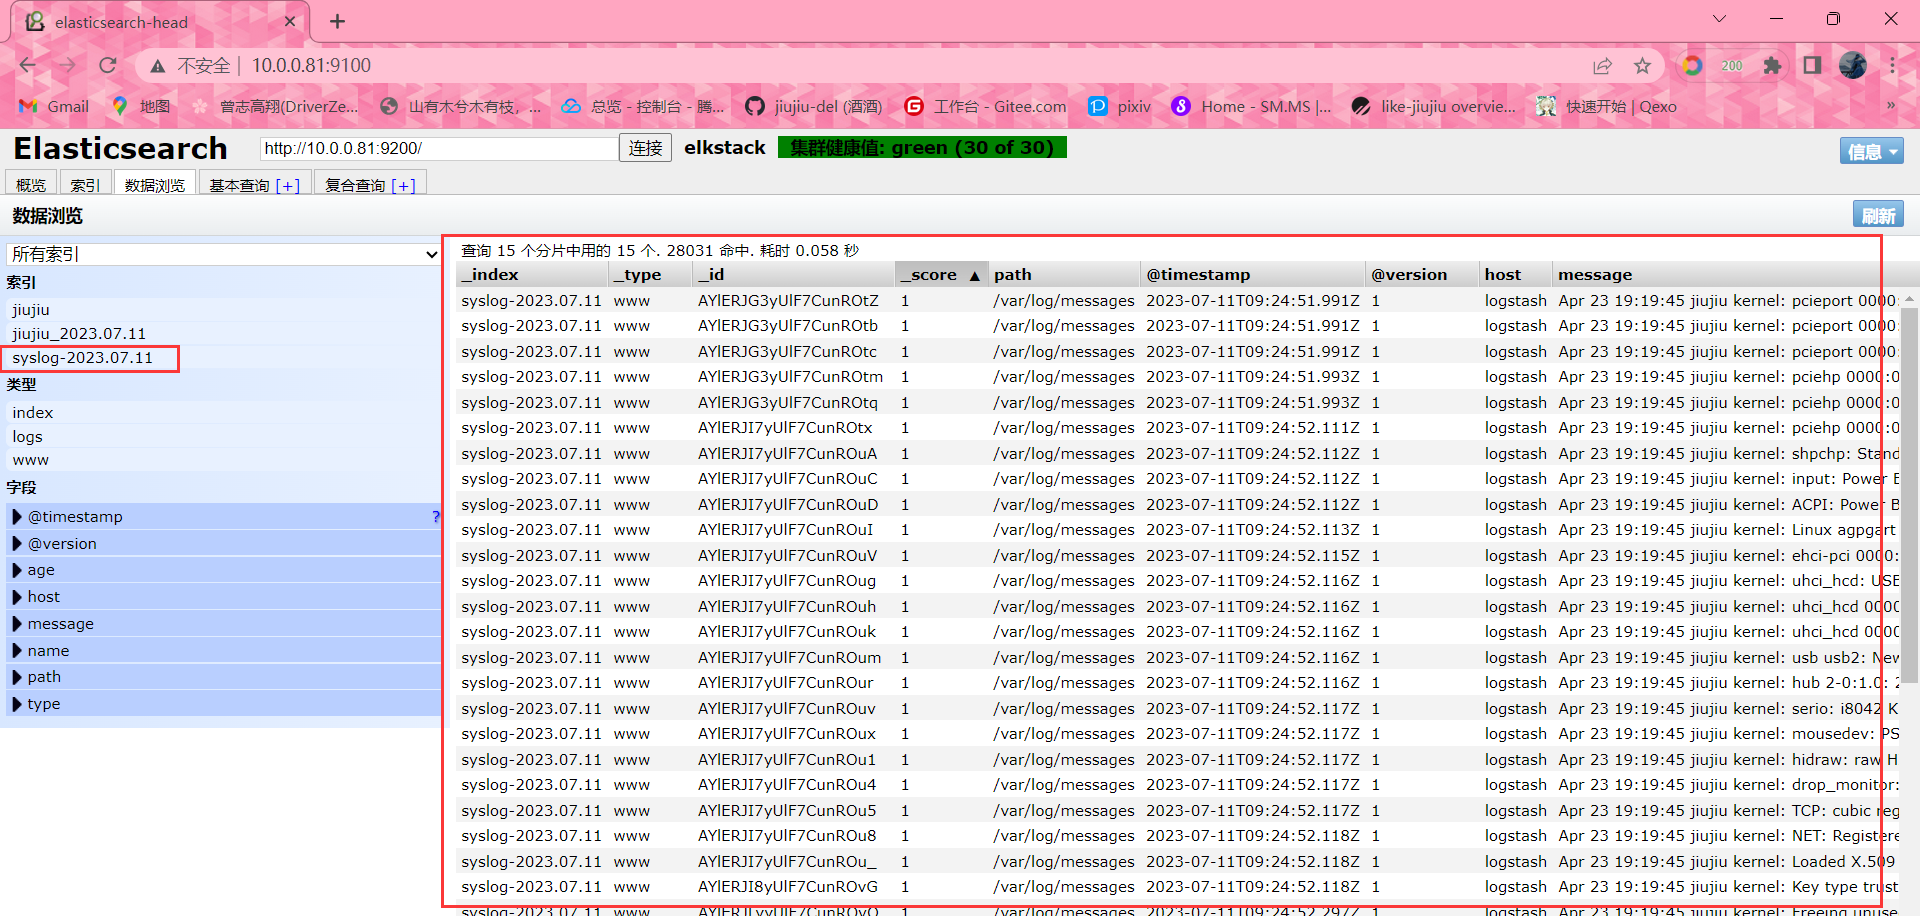
logstash收集系统日志到ES
#从标准输入到Elasticsearch
[root@logstash ~]# /usr/share/logstash/bin/logstash -e 'input { file { type => "www" path => "/var/log/messages" start_position => "beginning" } } output { elasticsearch { hosts => ["10.0.0.81:9200"] index => "syslog-%{+YYYY.MM.dd}" } }'
#命令解读
1. `/usr/share/logstash/bin/logstash`: 这是用于运行Logstash的可执行文件的路径。
2. `-e`: 这是一个选项,表示紧跟在其后的字符串是用于定义Logstash数据流配置的内联表达式。
3. `'input { file { type => "www" path => "/var/log/messages" start_position => "beginning" } } output { elasticsearch { hosts => ["10.0.0.81:9200"] index => "syslog-%{+YYYY.MM.dd}" } }'`: 这是用于定义Logstash数据流配置的内联表达式。
- `input`部分定义了数据的输入来源。在此配置中,使用了`file`输入插件,它将读取`/var/log/messages`文件。
- `type => "www"`: 这是为输入数据指定的类型。在此例中,类型被设置为`www`。 这个随意定义
- `path => "/var/log/messages"`: 这是要读取的日志文件的路径。
- `start_position => "beginning"`: 这是用于指定从文件的开头开始读取日志数据。
- `output`部分定义了数据的输出目的地。在此配置中,使用了`elasticsearch`输出插件,它将数据发送到Elasticsearch。
- `hosts => ["10.0.0.81:9200"]`: 这是Elasticsearch的主机地址和端口。
- `index => "syslog-%{+YYYY.MM.dd}"`: 这是用于定义将数据索引到Elasticsearch的索引名称。在此例中,索引名称将根据当前日期动态生成,形式为`syslog-年.月.日`。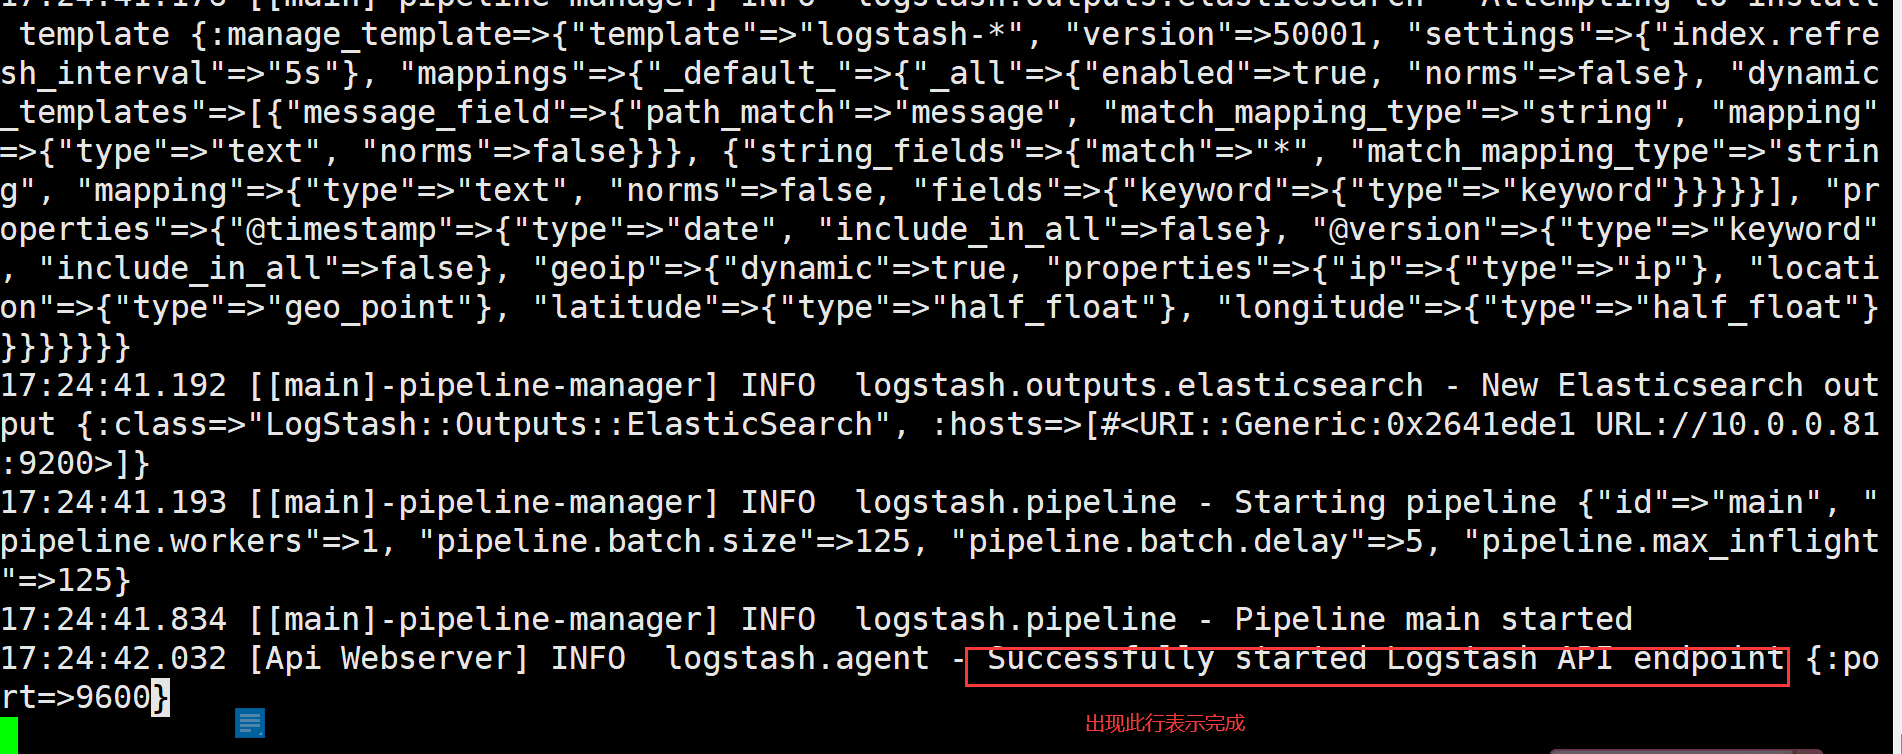
logstash收集信息配置文件写法
#移动到logstash配置文件目录下
cd /etc/logstash/conf.d/
#新建配置文件
vim message_file_es.conf
input{
    file{
    type => "msg_log"
    path => "/var/log/messages"
    start_position => "beginning"
    }
}
output{
    elasticsearch{
        hosts => ["10.0.0.81:9200"]
        index => 'msg_log-2023-07-12'
    }
}
# 启动logstash  // -f是指定配置文件
logstash -f /etc/logstash/conf.d/message_file_es.conf
# 检测配置文件语法  // -t
logstash -f /etc/logstash/conf.d/message_file_es.conf -t
Configuration OK   #//输出OK标为语法无问题
#放到后台运行   // &
logstash -f /etc/logstash/conf.d/message_file_es.conf &
-----------------------------------------------------------------------------------------------------
收集多个日志
#收集多个日志
input{
    file{
        type => "msg_log"
        path => "/var/log/messages"
        start_position => "beginning"
    }
    file{
        type => "sec_log"
        path => "/var/log/secure"
        start_position => "beginning"
    }
}
output{
    elasticsearch{
        hosts => ["10.0.0.81:9200"]
        index => "tls_msg_log-2023-07-12"
    }
    elasticsearch{
        hosts => ["10.0.0.81:9200"]
        index => "zls_sec_log-2023-07-12"
    }
}
优化写法
#优化时间
input{
    file{
        type => "msg_log"
        path => "/var/log/messages"
        start_position => "beginning"
    }
    file{
        type => "sec_log"
        path => "/var/log/secure"
        start_position => "beginning"
    }
}
output{
    elasticsearch{
        hosts => ["10.0.0.81:9200"]
        index => "tls_msg_log-%{+yyyy.MM.dd}"
}
    elasticsearch{
        hosts => ["10.0.0.81:9200"]
        index => "zls_sec_log-%{+yyyy.MM.dd}"
    }
}
#优化index名字
input{
    file{
        type => "msg"
        path => "/var/log/messages"
        start_position => "beginning"
    }
    file{
        type => "sec"
        path => "/var/log/secure"
        start_position => "beginning"
    }
}
output{
    elasticsearch{
        hosts => ["10.0.0.81:9200"]
        index => "%{type}-%{+yyyy.MM.dd}"
    }
}
logstash复制java日志
# 安装tomcat
yum install -y tomcat
# 创建目录
mkdir /usr/share/tomcat/webapps/ROOT
#创建文件
vim /usr/share/tomcat/webapps/ROOT/index.jsp
test tomcat
# 启动tomcat
systemctl start tomcat
# 检查端口
[root@elk04 ~]# netstat -lntup | grep 8080
tcp6 0 0 :::8080 :::* LISTEN 7332/java
# 检查日志
ll /var/log/tomcat
# 浏览器访问
10.0.0.83:8080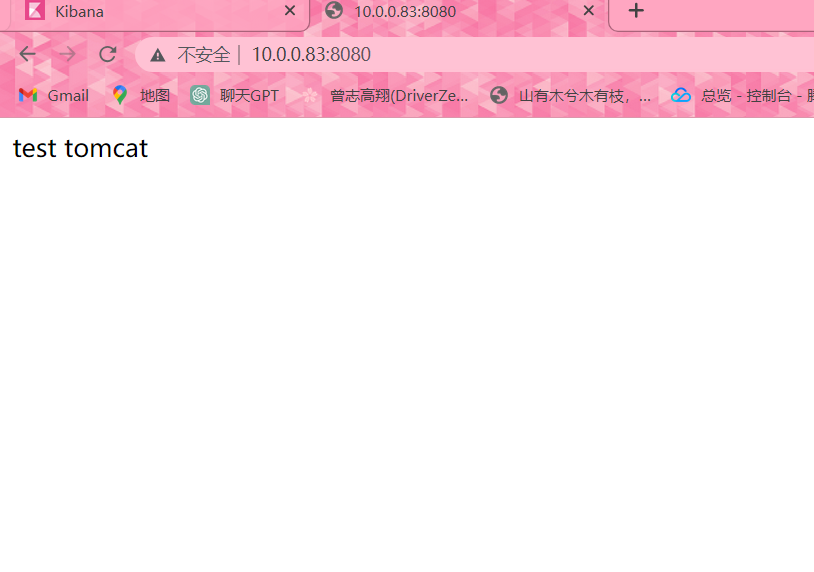
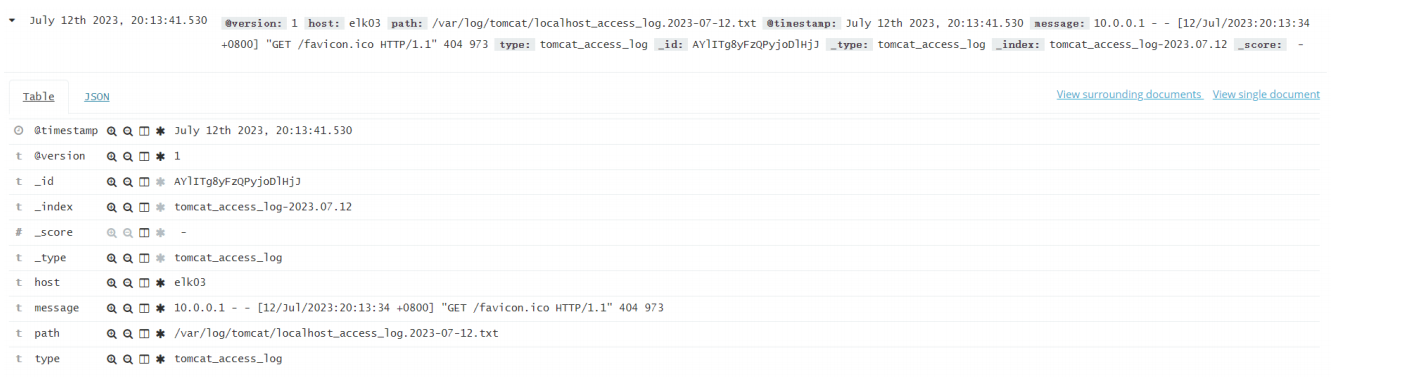
收集tomcat到ES
vim tomcat_file_es.conf
input{
    file{
        type => "tomcat_access_log"
        path => "/var/log/tomcat/localhost_access_log.2023-07-12.txt"
        start_position => "end"
    }
}
output{
    elasticsearch{
        hosts => ["10.0.0.81:9200"]
        index => "%{type}-%{+yyyy.MM.dd}"
    }
}
logstash -f ./tomcat_file_es.conf &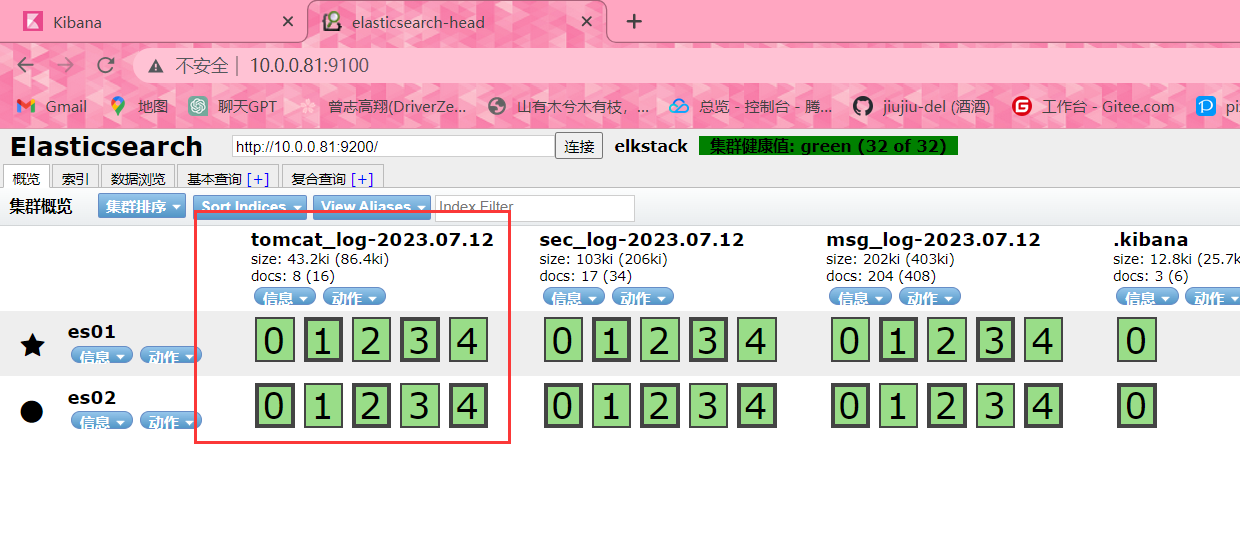
#放入Kibana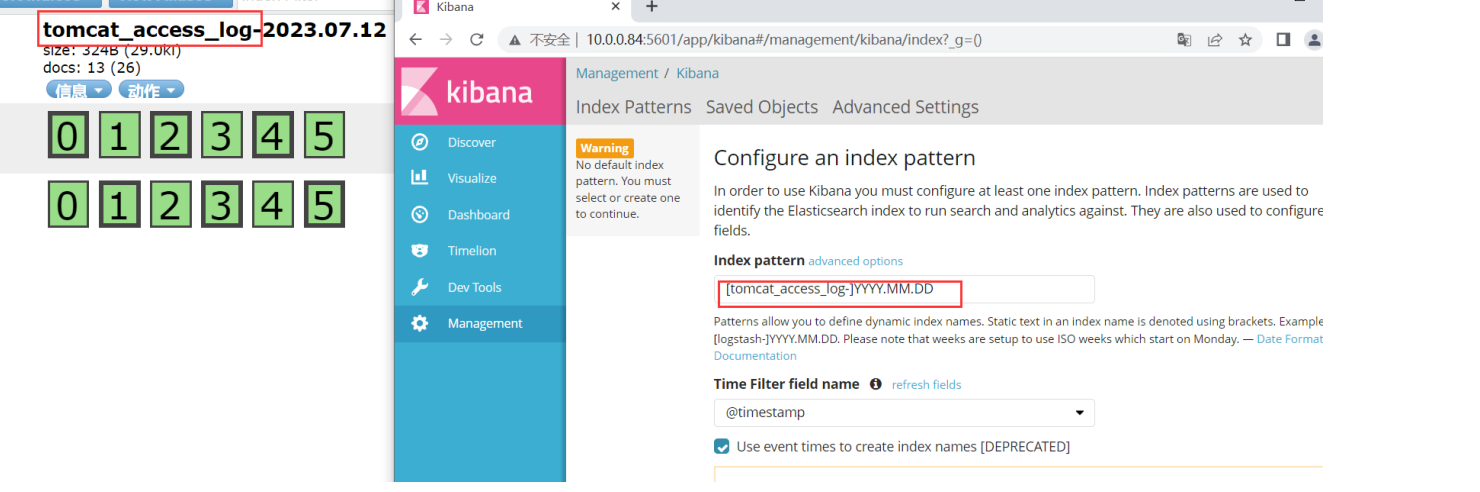
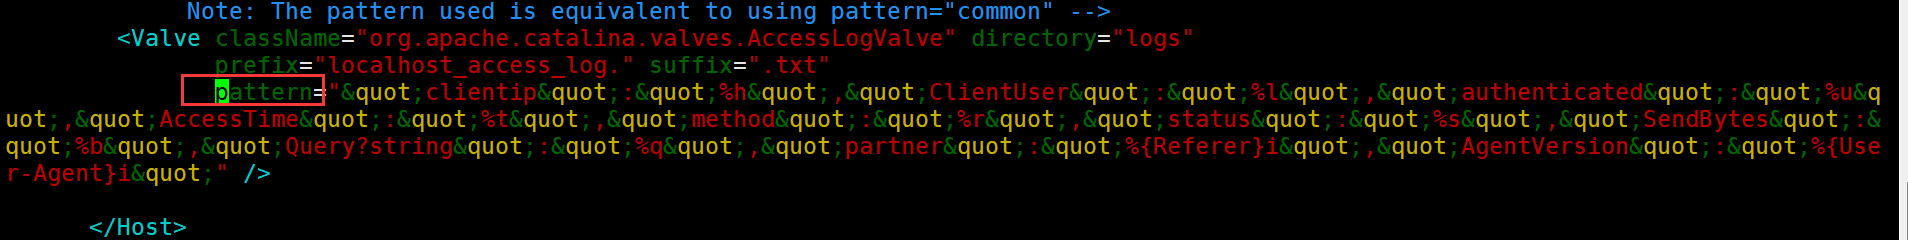
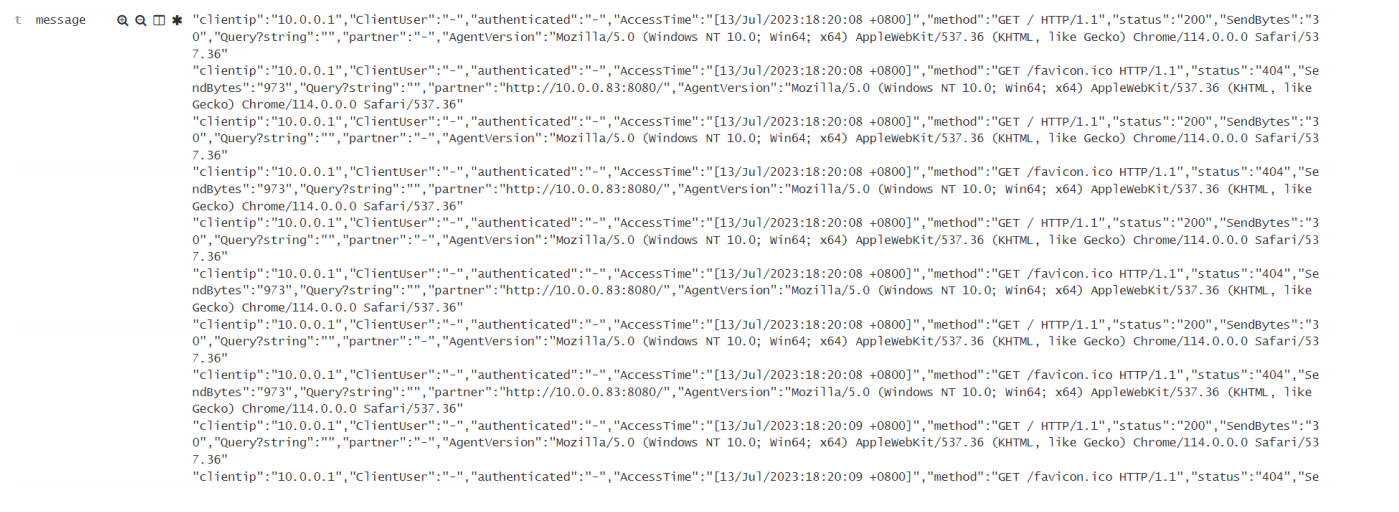
修改tomcat日志格式为Json
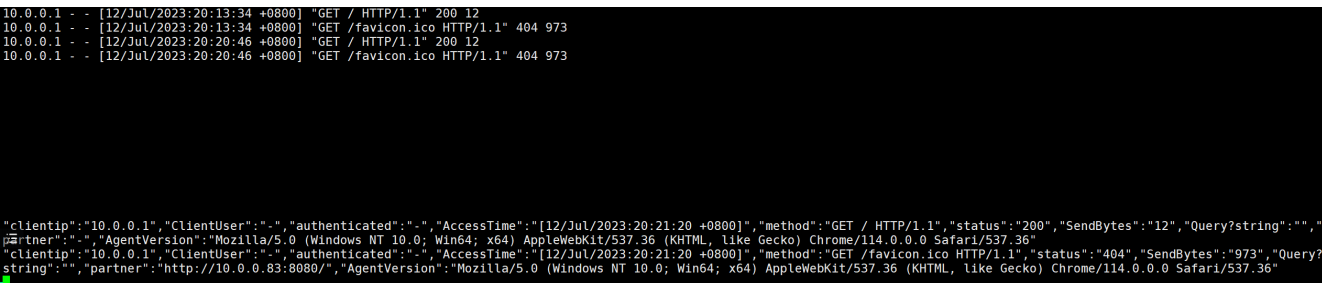
修改前的日志
#修改配置文件,内容如下 //137行左右
vim /etc/tomcat/server.xml
""clientip":"%h","ClientUser":"%l","authenticated":"%u","AccessTime":"%t","method":"%r","status":"%s","SendBytes":"%b","Query?string":"%q","partner":"%{Referer}i","AgentVersion":"%{User-Agent}i""
修改后的日志
logstash解析json格式
#编写配置文件
vim tomcat_file_es_json.conf
input{
    file{
        type => "tomcat_access_log_json"
        path => "/var/log/tomcat/localhost_access_log.2023-07-12.txt"
        start_position => "end"
    }
}
filter{
    json{
        source => "message"
    }
}
output{
    elasticsearch{
        hosts => ["10.0.0.81:9200"]
        index => "%{type}-%{+yyyy.MM.dd}"
    }
}
logstash -f ./tomcat_file_es_json.conf &
json日志和普通日志的区别

logstash收集nginx
# 安装nginx
[root@elk03 ~]# yum install -y nginx

# 编写nginx网页配置文件
[root@elk03 ~]# vim /etc/nginx/conf.d/www.conf
server{
        listen 80;
        server_name www.xxx.com;
        root /code;
        index index.html;
}

# 创建站点目录
[root@elk03 ~]# mkdir /code
[root@elk03 ~]# echo 'this nginx' > /code/index.html

# 域名解析
10.0.0.83 www.xxx.com

# 编写logstash配置文件
[root@elk03 ~]# vim /etc/logstash/conf.d/nginx_acc.conf
input{
        file{
                type => "nginx_acc_json_log"
                path => "/var/log/nginx/access.log"
                start_position => "end"
        }
}

output{
        elasticsearch{
                hosts => ["10.0.0.81:9200"]
                index => "%{type}-%{+yyyy.MM.dd}"
                codec => "json"
        }
}

# 启动logstash
[root@elk03 ~]# /usr/share/logstash/bin/logstash -t /etc/logstash/conf.d/nginx_acc.conf
修改nginx访问日志为json格式并且收集至es
# 修改nginx主配置文件
[root@elk03 ~]# vim /etc/nginx/nginx.conf
user nginx;
worker_processes auto;
error_log /var/log/nginx/error.log;
pid /run/nginx.pid;
include /usr/share/nginx/modules/*.conf;
events {
worker_connections 1024;
}
http {
log_format json '{"@timestamp":"$time_iso8601",'
'"host":"$server_addr",'
'"clientip":"$remote_addr",'
'"size":$body_bytes_sent,'
'"responsetime":$request_time,'
'"upstreamtime":"$upstream_response_time",'
'"upstreamhost":"$upstream_addr",'
'"http_host":"$host",'
'"url":"$uri",'
'"domain":"$host",'
'"xff":"$http_x_forwarded_for",'
'"referer":"$http_referer",'
'"status":"$status"}';
access_log /var/log/nginx/access.log json;
sendfile on;
tcp_nopush on;
tcp_nodelay on;
keepalive_timeout 65;
types_hash_max_size 4096;
include /etc/nginx/mime.types;
default_type application/octet-stream;
include /etc/nginx/conf.d/*.conf;
}
# 重启服务
[root@elk03 ~]# systemctl restart nginx
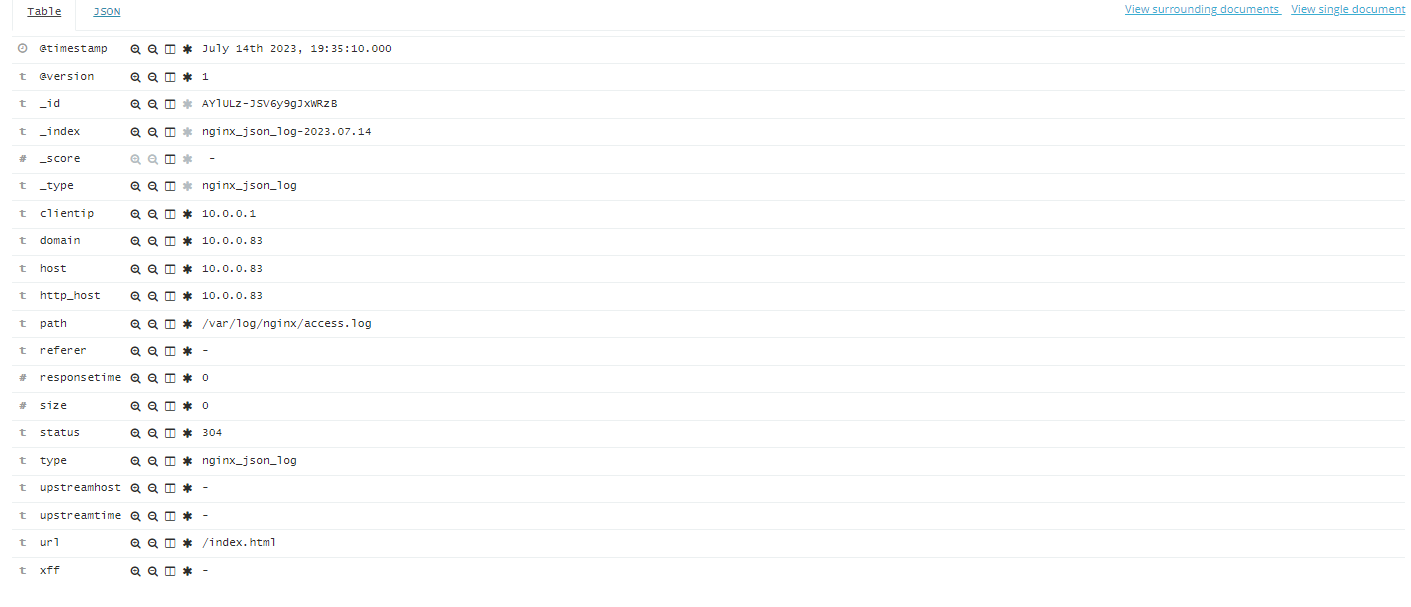
# 刷新网页 查看nginx日志
[root@elk03 ~]# tail -f /var/log/nginx/www.xxx.com_access_json.log
{"@timestamp":"2023-07-13T15:42:34+08:00","host":"10.0.0.83","clientip":"10.0.0.1","size":0,"responsetime":0.000,"upstreamtime":"-","upstreamhost":"-","http_host":"10.0.0.83","url":"/index.html","domain":"10.0.0.83","xff":"-","referer":"-","status":"304"}
# 编写logstash配置文件
[root@elk03 ~]# vim /etc/logstash/conf.d/nginx_acc.conf
input{
file{
type => 'nginx_json_log'
path => '/var/log/nginx/access.log'
start_position => 'end'
}
}
filter{
json{
source => 'message'
remove_field => ['message']
}
}
output{
elasticsearch{
hosts => ['10.0.0.81:9200']
index => '%{type}-%{+yyyy.MM.dd}'
}
}
# 启动logstash
[root@elk03 ~]# /usr/share/logstash/bin/logstash -f /etc/logstash/conf.d/nginx_acc.conf
# 查看10.0.0.83:9100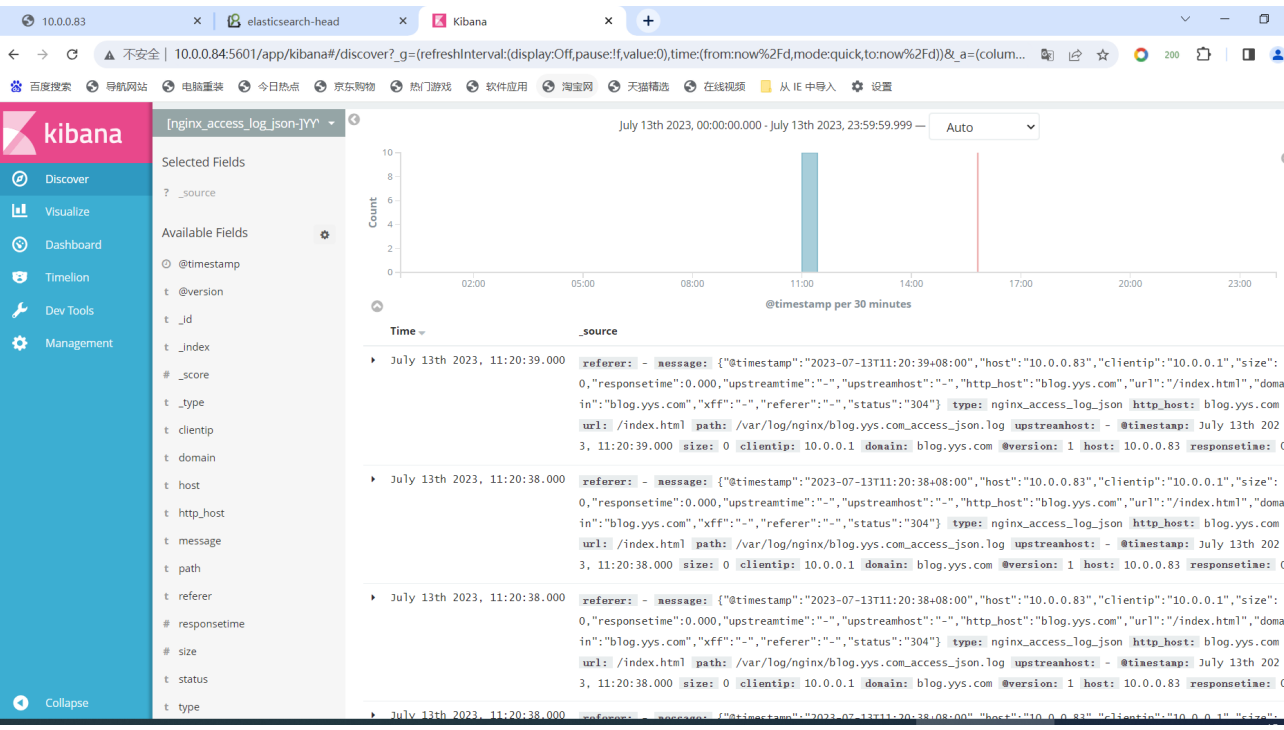
logstash收集日志优化删除多余字段
# 编写logstash配置文件
[root@elk03 ~]# vim /etc/logstash/conf.d/nginx_acc.conf
input{
    file{
        type => "access_log_json"
        path => "/var/log/nginx/access.log"
        start_position => "end"
        }
}
filter{
    json{
        source => 'message'
        remove_field => ['message']
    }
}
output{
    elasticsearch{
        hosts => ["10.0.0.81:9200"]
        index => "%{type}-%{+yyyy.MM.dd}"
        codec => 'json'
    }
}
logstash收集日志多行合并 //nginx日志格式改为默认
# 编写logstash配置文件
[root@elk03 ~]# vim /etc/logstash/conf.d/nignx_acc.conf
input{
    file{
        type => "access_log"
        path => "/var/log/nginx/access.log"
        start_position => "end"
        codec => multiline{
            pattern => '^[A-Z]'
            negate => 'true'
            what => 'previous'
            }
        }
}
output{
    elasticsearch{
        hosts => ["10.0.0.81:9200"]
        index => "%{type}-%{+yyyy.MM.dd}"
    }
}
Logstash深入-通过TCP/UDP收集日志
收集TCP/UDP日志
通过logstash的tcp/udp插件收集日志,通常用于在向elasticsearch日志补录丢失的部分日志,可以将丢失的日志通过一个TCP端口直接写入到elasticsearch服务器。
## 在input里使用tcp模块 port启动一个端口 type指定类型(自定义) mode指定为server(服务端)
## 在output指定转码为rubydebug

## 编写logstash的配置文件
[root@elk03 [~]# cat /etc/logstash/conf.d/tcp_log.conf
input{
    tcp{
        port => '1234'
        type => 'tcp_log'
        mode => 'server'
    }
}
output{
    stdout{
        codec => rubydebug
    }
}

# 启动Logstash
[root@elk03 [~]# logstash -f /etc/logstash/conf.d/tcp_log.conf

# 查看端口是否启动
[root@elk03 [~]# netstat -lntup
tcp6       0      0 :::1234                 :::*                    LISTEN      8505/java

## 此时就是在机器上起了一个1234端口来接收其他人传输的数据然后用rubydebug转码后显示到终端上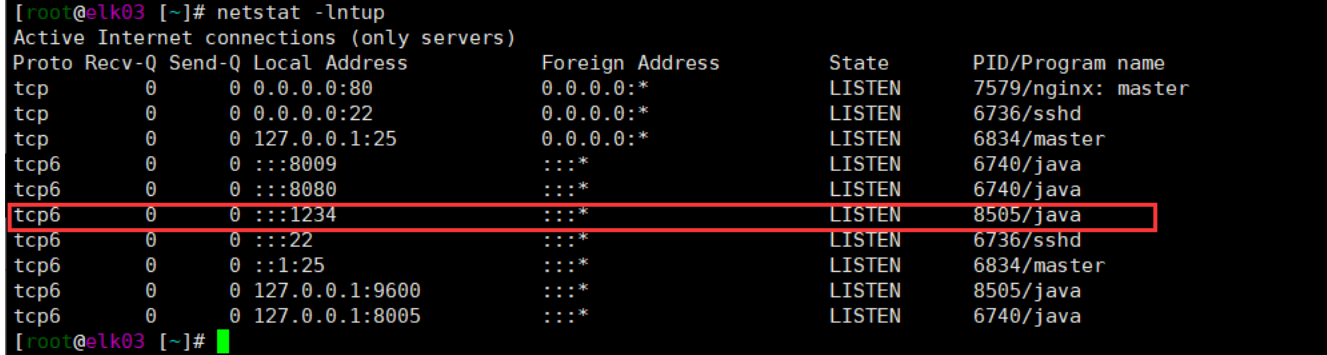
# 换一台机器通过telnet传输数据
[root@elk02 [~]# telnet 10.0.0.83 1234
Trying 10.0.0.83...
Connected to 10.0.0.83.
Escape character is '^]'.
nginx # 在这里我们输入nginx测试一下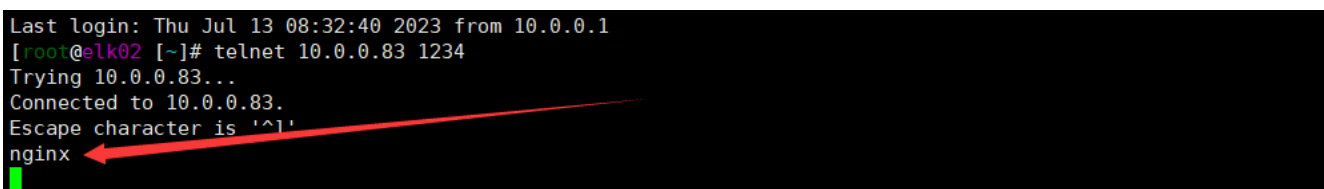
# 切回logstash的机器 就能看见传输的内容。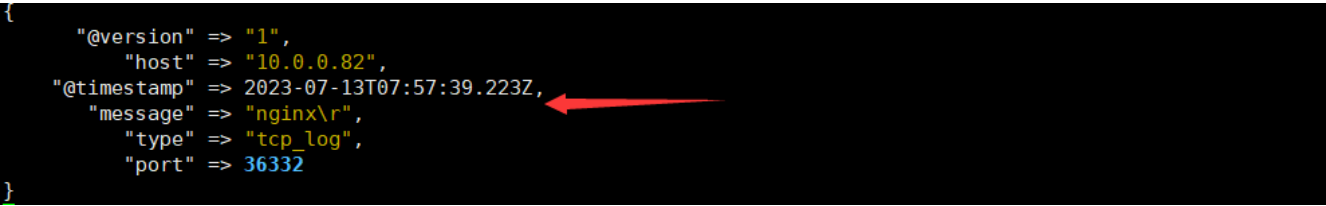
#退出telnet模式
ctrl + ]
然后输入\q 回车
使用nc传输日志
NetCat简称nc,在网络工具中有瑞士军刀美誉,其功能实用,是一个简单、可靠的网络工具,可通过
TCP或UDP协议传输读写数据,另外还具有很多其他功能。
在其它服务器安装nc命令
# 安装
[root@elk02 [~]# yum install -y nc
# 使用nc传输数据
[root@elk02 [~]# echo '你好世界' | nc 10.0.0.83 1234
# 再去logstash机器查看一下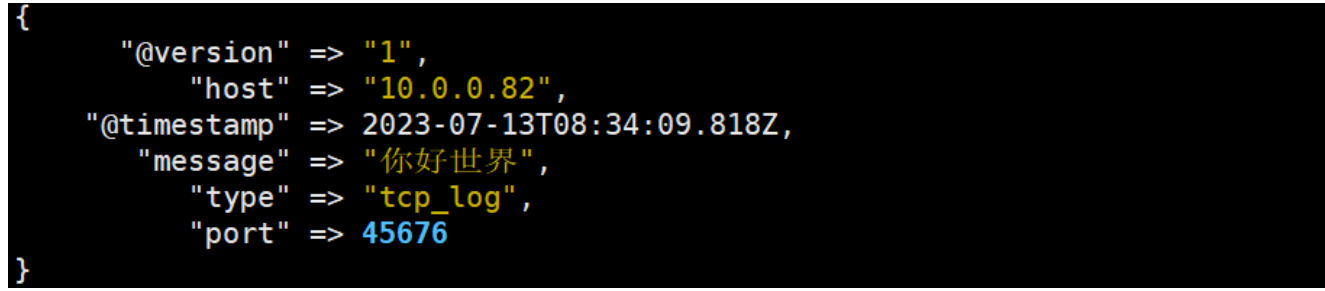
还可以通过nc发送文件
## 将/etc/passwd文件当成日志文件传送
[root@elk02 [~]# nc 10.0.0.83 1234 < /etc/passwd
# 结果如下,我们不难发现,Logstash会将传送来的日志文件 一行一行 读取,收集成日志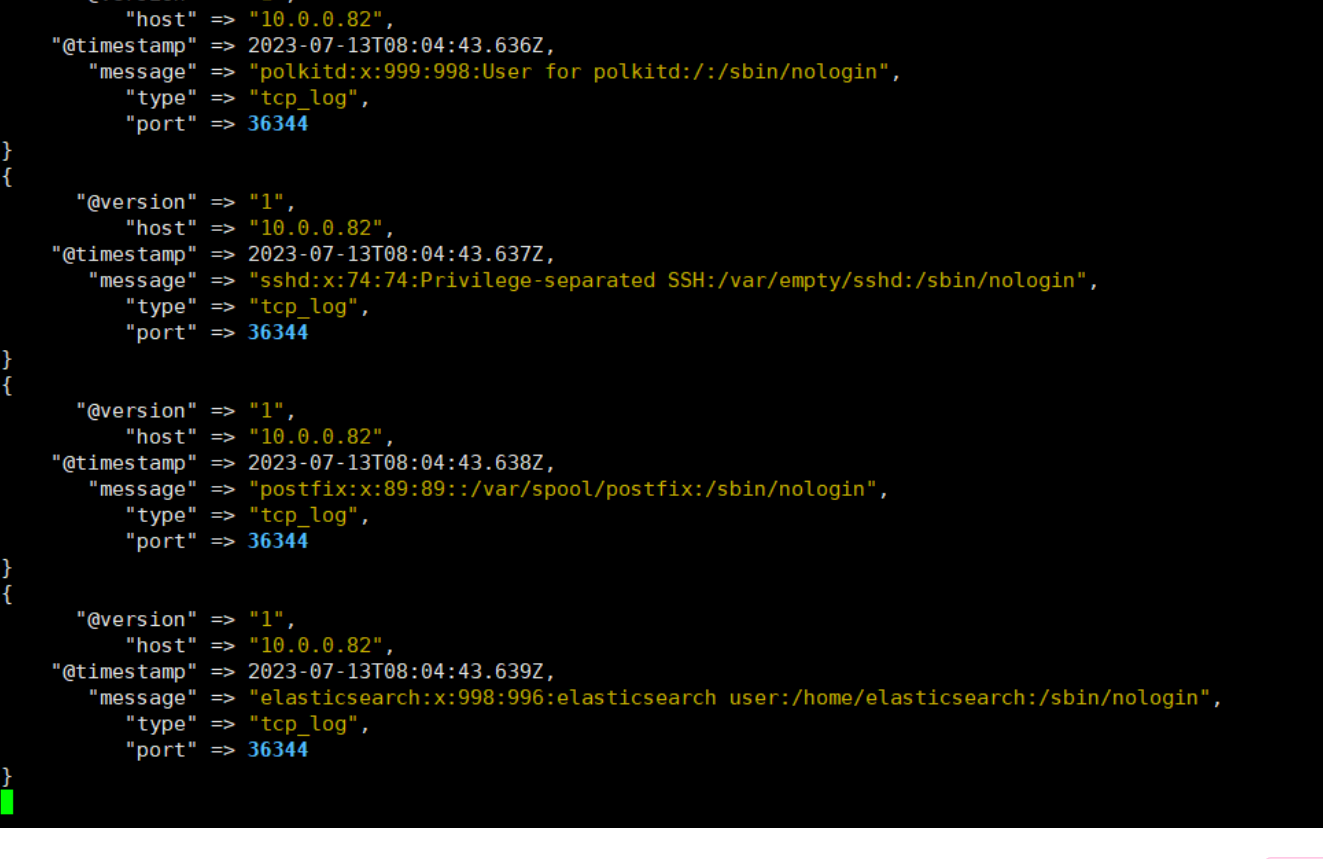
通过伪设备的反式发送日志
在类Unix操作系统中,设备节点并不一定要对应物理设备。没有这种对应关系的设备是伪设备。操作系
统运用了它们提供的多种功能,tcp只是dev下面众多伪设备当中的一种设备。
# 发送数据
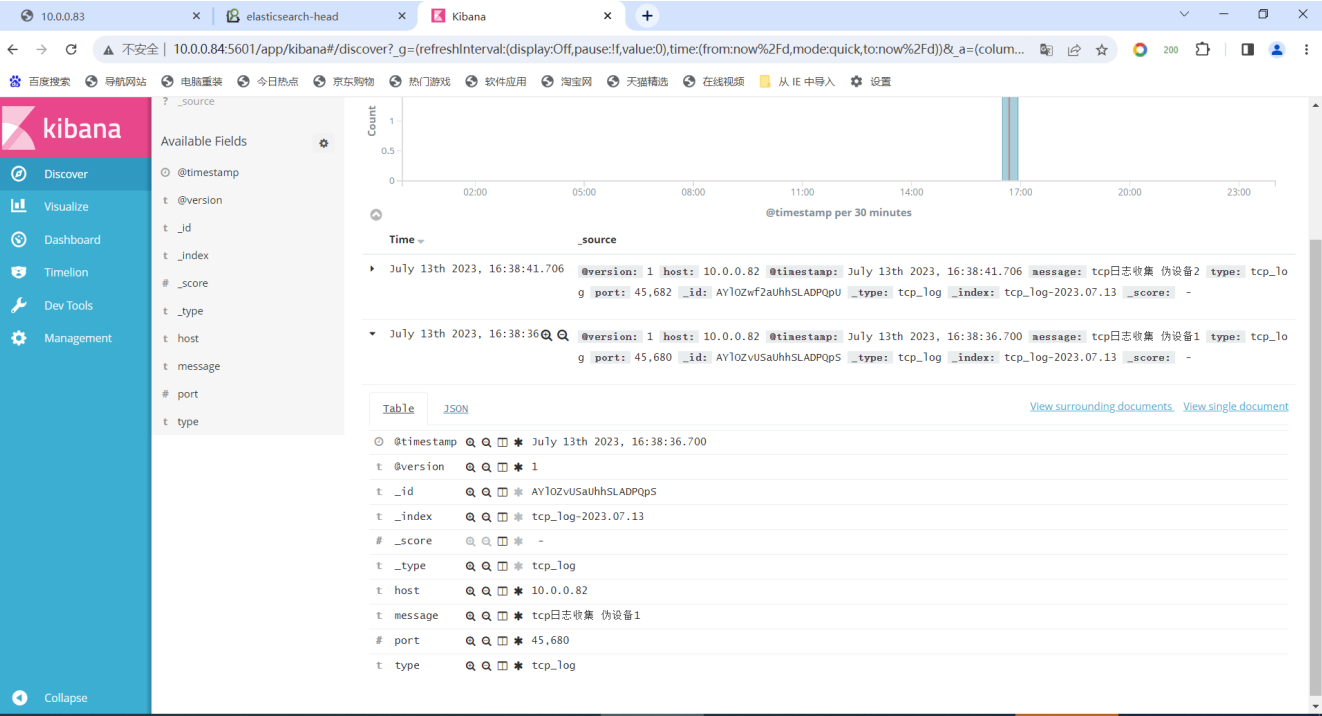
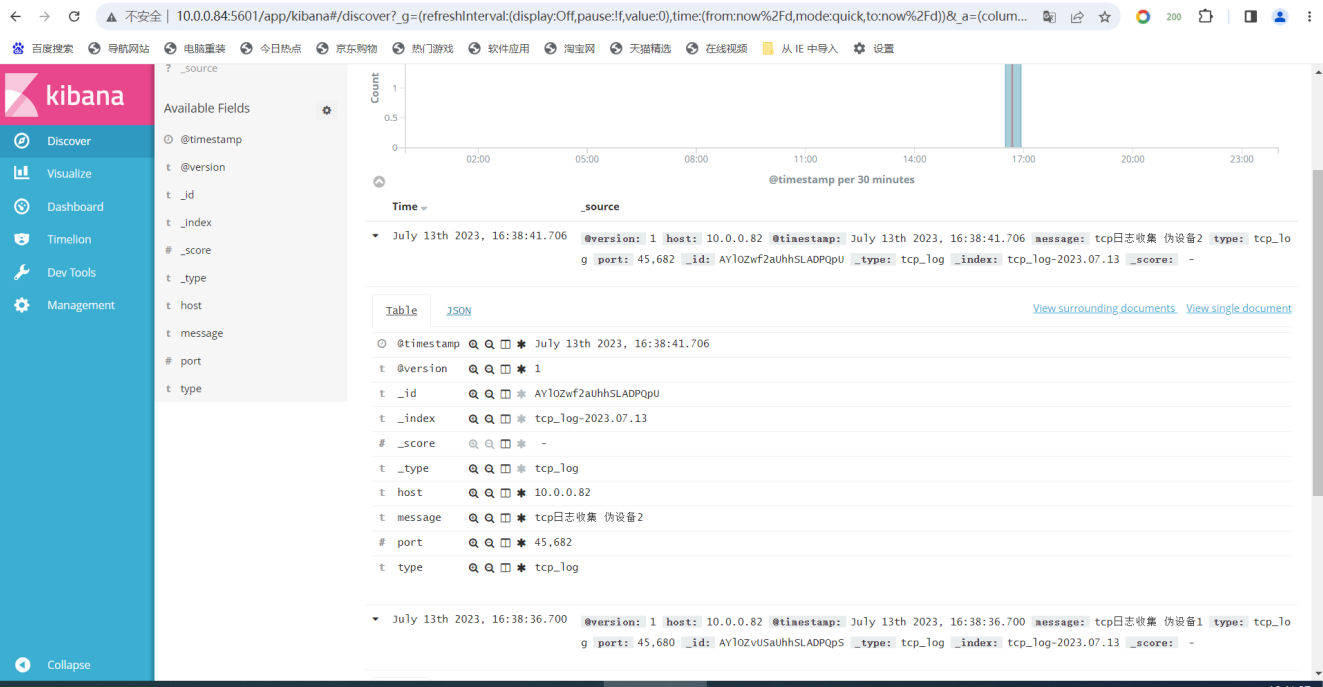
[root@elk02 [~]# echo '你好上海 伪设备' > /dev/tcp/10.0.0.83/1234将输出改成ES
# 编辑配置文件
[root@elk03 [~]# cat /etc/logstash/conf.d/tcp_log.conf
input{
    tcp{
        port => '1234'
        type => 'tcp_log'
        mode => 'server'
    }
}
output{
    elasticsearch{
        hosts => ["10.0.0.81:9200"]
        index => "%{type}-%{+yyyy.MM.dd}"
    }
}
# 启动
[root@elk03 [~]# logstash -f /etc/logstash/conf.d/tcp_log.conf
# 这个时候我们在其他机器先写入一些数据
[root@elk02 [~]# echo 'tcp日志收集 伪设备1' > /dev/tcp/10.0.0.83/1234
[root@elk02 [~]# echo 'tcp日志收集 伪设备2' > /dev/tcp/10.0.0.83/1234
#先访问10.0.0.81:9100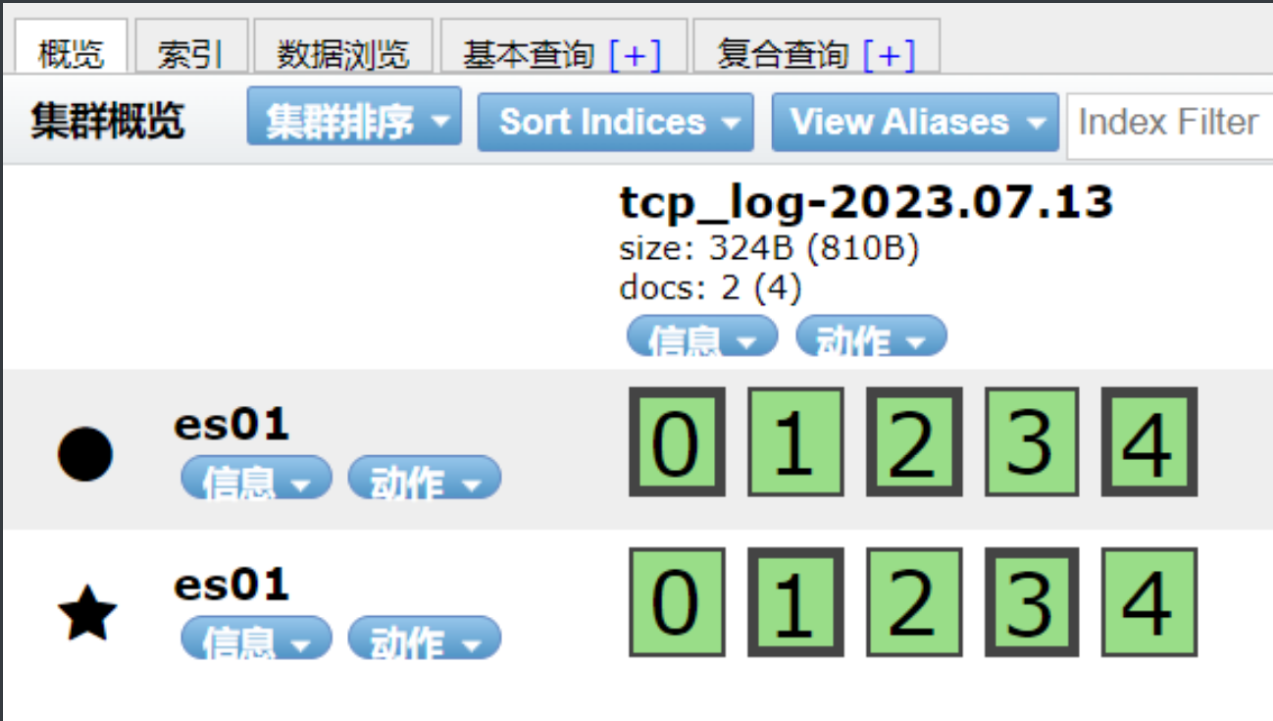
将ES索引添加至Kibana中
logstash配合rsyslog收集haproxy日志
rsyslog简介
在centos 6及之前的版本叫做syslog,centos 7开始叫做rsyslog,根据官方的介绍,rsyslog(2013年版
本)可以达到每秒转发百万条日志的级别,官方网址:http://www.rsyslog.com/
安装配置rsyslog
# 安装配置rsyslog
[root@elk03 ~]# yum install -y rsyslog
# 修改配置文件   //打开15 16 19 20行的注释
[root@elk03 ~]# vim /etc/rsyslog.conf
14 # Provides UDP syslog reception
15 $ModLoad imudp
16 $UDPServerRun 514
18 # Provides TCP syslog reception
19 $ModLoad imtcp
20 $InputTCPServerRun 514:
92 local7.* @@10.0.0.83:2222
# 启动服务
[root@elk03 ~]# systemctl start rsyslog
# 查看进程
[root@elk03 ~]# ps -ef | grep rsyslog
root 8317 1 0 13:27 ? 00:00:00 /usr/sbin/rsyslogd -n
root 9583 9423 0 15:08 pts/1 00:00:00 grep --color=auto rsyslog
安装配置haproxy
# 安装haproxy
[root@elk03 ~]# yum install -y haproxy
# 修改配置文件 //全部删除,替换为如下配置,期中backend的ip和端口根据实际环境填写
[root@elk03 ~]# vim /etc/haproxy/haproxy.cfg
global
maxconn 100000
chroot /var/lib/haproxy
uid 99
gid 99
daemon
nbproc 1
pidfile /var/run/haproxy.pid
log 127.0.0.1 local7 info
defaults
option http-keep-alive
option forwardfor
maxconn 100000
mode http
timeout connect 300000ms
timeout client 300000ms
timeout server 300000ms
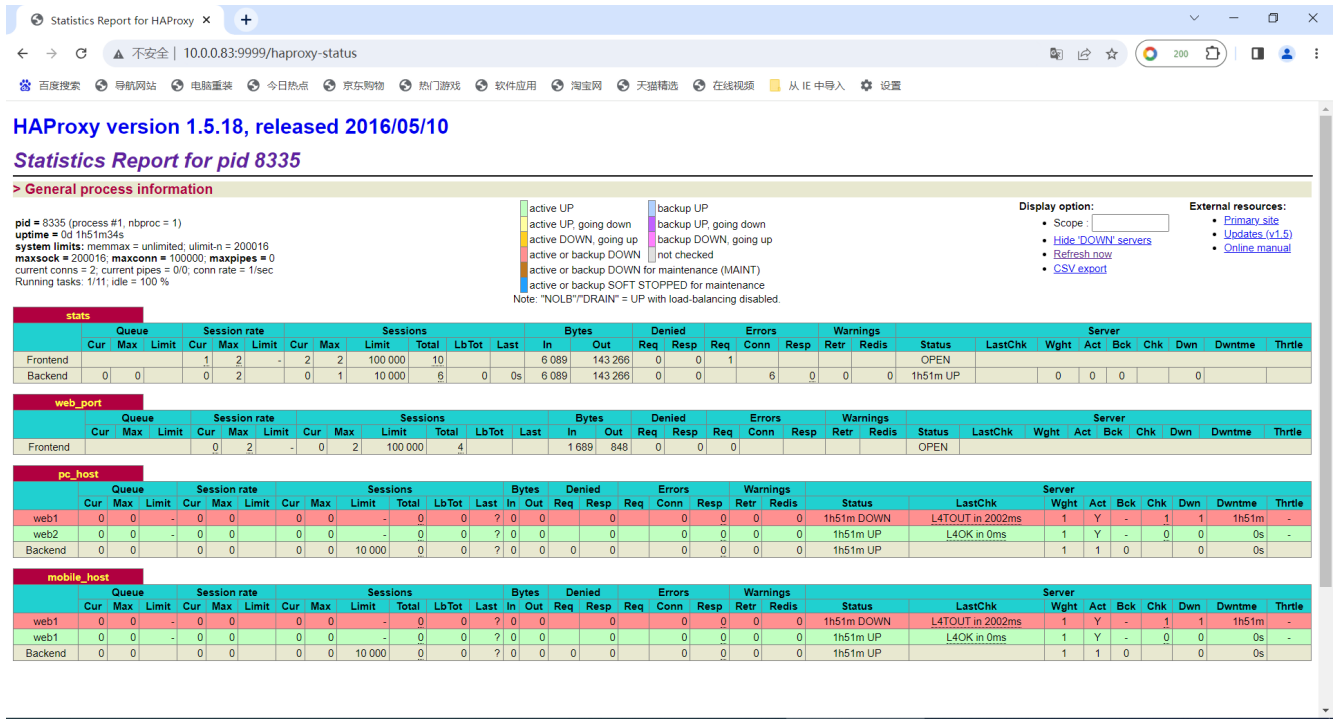
listen stats
mode http
bind 0.0.0.0:9999
stats enable
log global
stats uri /haproxy-status
stats auth haadmin:123456
#frontend web_port
frontend web_port
bind 0.0.0.0:80
mode http
option httplog
log global
option forwardfor
###################ACL Setting##########################
acl pc hdr_dom(host) -i www.elk.com
acl mobile hdr_dom(host) -i m.elk.com
###################USE ACL##############################
use_backend pc_host if pc
use_backend mobile_host if mobile
########################################################
backend pc_host
mode http
option httplog
balance static-rr
server web1 10.0.0.81:8090 check inter 2000 rise 3 fall 2 weight 1
server web2 10.0.0.82:8090 check inter 2000 rise 3 fall 2 weight 1
backend mobile_host
mode http
option httplog
balance static-rr
server web1 10.0.0.81:8091 check inter 2000 rise 3 fall 2 weight 1
server web1 10.0.0.82:8091 check inter 2000 rise 3 fall 2 weight 1
-----------------------------------------------------------------------------------------------------
#配置解读
global:
- 设置HAProxy实例的全局参数,如最大连接数和进程ID文件的位置。
defaults:
- 设置前端和后端部分的默认参数。
- 包括启用HTTP保持活动连接,转发客户端IP地址,以及设置连接的超时值。
listen stats:
- 创建一个用于HAProxy统计数据的监听器。
- 设置绑定地址和端口,启用统计数据URI,并设置访问统计页面的认证凭据。
frontend web_port:
- 创建一个前端监听器,用于处理传入的HTTP请求。
- 设置绑定地址和端口,HTTP日志选项,并启用转发客户端IP地址。
ACL设置:
- 根据主机头值定义访问控制列表(ACL),对请求进行分类。
- 创建两个ACL,“pc”和“mobile”,基于“www.elk.com”和“m.elk.com”主机值。
使用ACL:
- 根据ACL条件将请求转发到特定的后端。
- 如果“pc”ACL匹配,则将请求转发到“pc_host”后端;如果“mobile”ACL匹配,则将请求转发到“mobile_host”后端。
backend pc_host:
- 后端配置用于处理“pc_host”请求。
- 设置HTTP日志选项、静态循环算法的负载均衡方式以及后端服务器的地址和检查参数。
backend mobile_host:
- 后端配置用于处理“mobile_host”请求。
- 设置HTTP日志选项、静态循环算法的负载均衡方式以及后端服务器的地址和检查参数。
# 启动服务
[root@elk03 ~]# systemctl start haproxy
# 访问10.0.0.83:9999/haproxy-status
#用户名和密码默认:haadmin:123456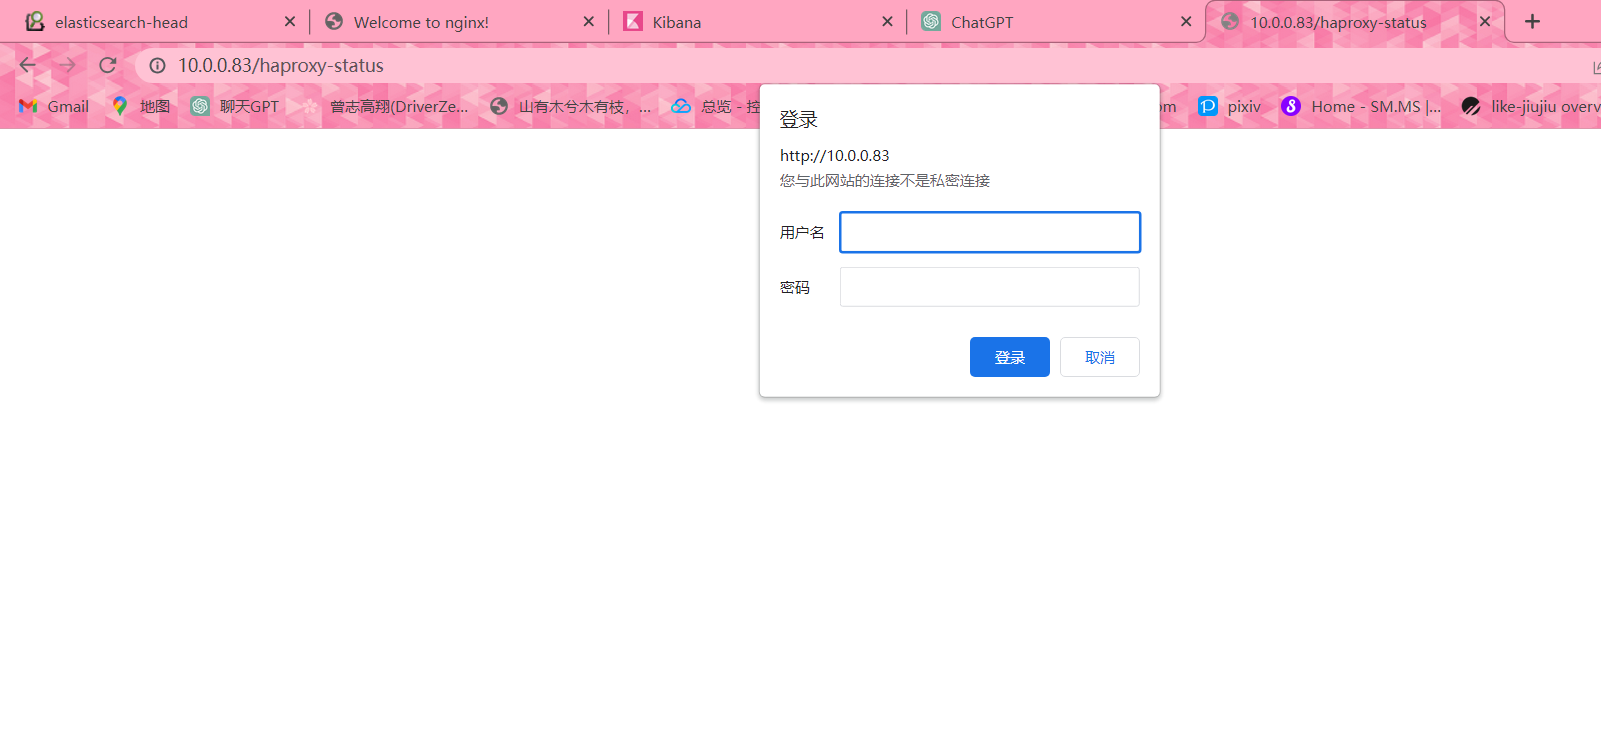
连接远端的nginx
# 安装nginx
[root@db01 ~]# yum install -y nginx
# 编辑nginx配置文件
[root@db01 ~]# cat /etc/nginx/conf.d/www.conf /etc/nginx/conf.d/xxx.conf
server{
    listen 8090;
    server_name _;
    root /code;
    index index.html;
}
server{
    listen 8091;
    server_name _;
    root /blog;
    index index.html;
}
# 创建站点目录和index文件
[root@db01 ~]# mkdir /{code,blog}
[root@db01 ~]# echo 'this nginx' > /code/index.html
[root@db01 ~]# echo 'this xxx' > /blog/index.html
# 修改haproxy配置文件
[root@elk03 ~]# vim /etc/haproxy/haproxy.cfg
global
    maxconn 100000
    chroot /var/lib/haproxy
    uid 99
    gid 99
    daemon
    nbproc 1
    pidfile /var/run/haproxy.pid
    log 127.0.0.1 local7 info
defaults
    option http-keep-alive
    option forwardfor
    maxconn 100000
    mode http
    timeout connect 300000ms
    timeout client 300000ms
    timeout server 300000ms
listen stats
    mode http
    bind 0.0.0.0:9999
    stats enable
    log global
    stats uri /haproxy-status
    stats auth haadmin:123456
#frontend web_port
frontend web_port
    bind 0.0.0.0:80
    mode http
    option httplog
    log global
    option forwardfor
###################ACL Setting##########################
acl pc hdr_dom(host) -i www.elk.com
acl mobile hdr_dom(host) -i m.elk.com
###################USE ACL##############################
use_backend pc_host if pc
use_backend mobile_host if mobile
########################################################
backend pc_host
    mode http
    option httplog
    balance static-rr
    server web1 10.0.0.81:8090 check inter 2000 rise 3 fall 2 weight 1
    server web2 10.0.0.82:8090 check inter 2000 rise 3 fall 2 weight 1
backend mobile_host
    mode http
    option httplog
    balance static-rr
    server web1 10.0.0.81:8091 check inter 2000 rise 3 fall 2 weight 1
    server web1 10.0.0.82:8091 check inter 2000 rise 3 fall 2 weight 1
# 重启haproxy
[root@elk03 ~]# systemctl restart haproxy
# 本地域名解析
10.0.0.83 www.elk.com  m.elk.com
logstash通过rsyslog收集haproxy日志
# 编写logstash配置文件
[root@elk03 ~]# vim /etc/logstash/conf.d/syslog_acc.conf
input{
    syslog{
        type => 'rsyslog_haproxy_log'
        port => '2222'
    }
}
output{
    elasticsearch{
        hosts => ["10.0.0.81:9200"]
        index => '%{type}-%{+yyyy.MM.dd}'
    }
}
# 启动logstash
[root@elk03 ~]# logstash -f /etc/logstash/conf.d/syslog_acc.conf
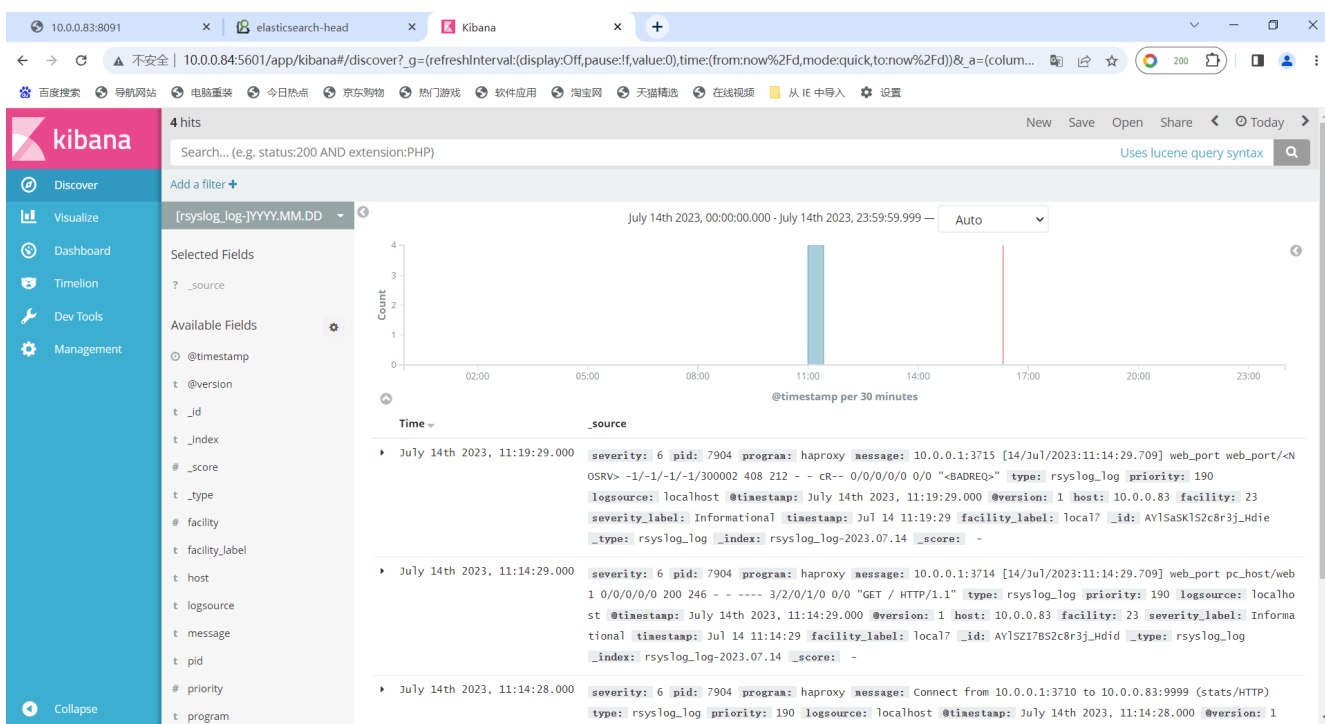
#原理
logstsh监听了2222端口
rsyslog是接受到了haproxy的日志然后转发给10.0.0.83:2222
logstash启动2222端口试试接受resyslog传来的日志
logstash停掉 2222消失
2222是logstash起的
Logstash深入Logstash与Redis
# 下载redis包
[root@db01 ~]# wget http://download.redis.io/releases/redis-3.2.12.tar.gz
# 解压包
[root@db01 ~]# tar xf redis-3.2.12.tar.gz
# 创建目录 编辑软链接
[root@db01 ~]# mkdir /app
[root@db01 ~]# mv redis-3.2.12 /app/
[root@db01 ~]# ln -s /app/redis-3.2.12/ /app/redis
# 编译
[root@db01 ~]# cd /app/redis
[root@db01 ~]# make
# 添加环境变量
[root@db01 ~]# vim /etc/profile.d/redis.sh
export PATH="/app/redis/src:$PATH"
#环境变量生效
[root@db01 redis]# source /etc/profile
# 创建配置文件目录
[root@db01 ~]# mkdir -p /data/6379
[root@db01 ~]# vim /data/6379/redis.conf
port 6379
daemonize yes
pidfile /data/6379/redis.pid
logfile "/data/6379/redis.log"
dbfilename dump.rdb
dir /data/6379
protected-mode no
# 启动服务
[root@db01 ~]# redis-server /data/6379/redis.conf
logstash收集日志输出值redis
# 编辑logstash配置文件
[root@elk03 ~]# vim /etc/logstash/conf.d/log.conf
input{
    file{
        type => 'nginx_log'
        path => '/var/log/nginx/access.log'
        start_position => 'end'
    }
}
output{
    redis{
        data_type => 'list'
        key => 'nginx_log'
        host => '10.0.0.51'
        port => '6379'
        db => '15'
    }
}
#启动服务
[root@logstash ~]# /usr/share/logstash/bin/logstash -f /etc/logstash/conf.d/log.conf
# 查看redis
[root@db01 ~]# redis-cli
127.0.0.1:6379> select 15
OK
127.0.0.1:6379[15]> keys *
1) "nginx_log"
llen nginx_log 查看长度
lrange nginx_log 0 2 查看前三条日志消息
lpo nginx_log 删除当前日志
Logstash从Redis中取出日志输出到ES
# 我们在elk04机器上安装logstash 收集db01中redis的数据
# 安装logstash java(安装包在文档同名目录)
[root@elk04 [~]# yum install -y java
[root@elk04 [~]# yum localinstall -y logstash-5.6.16.rpm
# 授权
chown logstash.logstash -R /usr/share/logstash/
# 定义Logstash进程使用的Java虚拟机(JVM)的初始堆内存大小(-Xms)和最大堆内存大小(-Xmx)
[root@elk04 [~]# vim /etc/logstash/jvm.options
-Xms256m
-Xmx256m
# 编写logstash的配置文件
[root@elk04 [~]# cat /etc/logstash/conf.d/nginx_redis.conf
input{
    redis{
        data_type => 'list'
        key => 'nginx_log'
        host => '10.0.0.51'
        port => '6379'
        db => '15'
        codec => 'json'
    }
}
filter{
    json{
        source => 'message'
        remove_field => ['message']
    }
}
output{
    elasticsearch{
        hosts => ['10.0.0.81:9200']
        index => '%{type}-%{+yyyy.MM.dd}'
    }
}
# 启动
[root@elk04 ~]# /usr/share/logstash/bin/logstash -f /etc/logstash/conf.d/nginx_redis.conf
# 查看redis
[root@db01 ~]# redis-cli
127.0.0.1:6379> select 15
OK
127.0.0.1:6379[15]> keys *
(empty list or set)
# 访问10.0.0.81:9100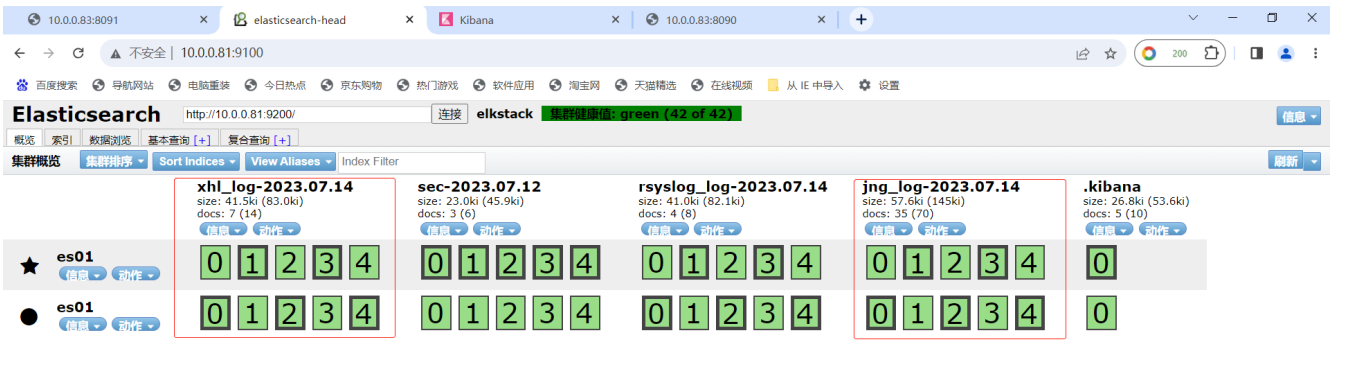
filebeat
filebeat介绍及部署:
Filebeat附带预构建的模块,这些模块包含收集、解析、充实和可视化各种日志文件格式数据所需的配置,每个Filebeat模块由一个或多个文件集组成,这些文件集包含摄取节点管道、Elasticsearch模板、Filebeat勘探者配置和Kibana仪表盘。
Filebeat模块很好的入门,它是轻量级单用途的日志收集工具,用于在没有安装java的服务器上专门收集日志,可以将日志转发到logstash、elasticsearch或redis等场景中进行下一步处理。
部署filebest
# 下载filebeat
wget https://artifacts.elastic.co/downloads/beats/filebeat/filebeat-5.6.16-x86_64.rpm
# 安装
yum localinstall filebeat-5.6.16-x86_64.rpm -y
# 备份配置文件
[root@elk03 ~]# cp /etc/filebeat/filebeat.yml{,.bak}
filebeat收集日志输出到文件
# 配置文件  //全部删除。yml格式一定需要正确书写
vim /etc/filebeat/filebeat.yml
-----------------------------------------------------------------------------------------------------
filebeat.prospectors:
- input_type: log
  paths:
    - /var/log/nginx/access.log
  exclude_lines: ["^DBG","^$"]   # 不需要收集的行
  document_type: nginx_log  # 日志类型
output.file:
  path: "/tmp"
  filename: "nginx.txt"
-----------------------------------------------------------------------------------------------------
# 启动filebeat
[root@logstash ~]# systemctl start filebeat
# 检查进程
[root@logstash ~]#  ps -ef | grep filebeat
root       8335      1  0 10:47 ?        00:00:02 /usr/share/filebeat/bin/filebeat -c /etc/filebeat/filebeat.yml -path.home /usr/share/filebeat -path.config /etc/filebeat -path.data /var/lib/filebeat -path.logs /var/log/filebeat
root       8825   8105  0 13:52 pts/2    00:00:00 grep --color=auto filebeat
#启动nginx,并刷新页面使其产生日志记录
[root@logstash ~]# systemctl start nginx
#查看/tmp下是否生成nginx.txt文件
[root@logstash ~]# ll /tmp/
total 12
drwxr-xr-x 2 root root     6 Jul 17 13:40 hsperfdata_root
-rw------- 1 root root 11349 Jul 17 13:57 nginx.txt
drwx------ 2 root root     6 Jul 17 08:21 vmware-root_5975-1681202013
drwx------ 2 root root     6 Jul 11 16:43 vmware-root_6092-994685407
drwx------ 2 root root     6 Jul 14 15:45 vmware-root_6117-1991519287
#如果没有生成文件。删除下列文件即可
[root@logstash ~]# rm -f /var/lib/filebeat/registry
filebeat收集日志输出到ES
#编辑配置文件
vim /etc/filebeat/filebeat.yml
-----------------------------------------------------------------------------------------------------
filebeat.prospectors:
- input_type: log
  paths:
    - /var/log/nginx/access.log
  exclude_lines: ["^DBG", "^$"] ## 不需要收集的行
  document_type: nginx_log       # 日志类型
output.logstash:
  hosts: ["10.0.0.83:100"]
  enabled: true   #是否开启logstash,默认true
  worker: 1    #工作进程
  compression_level: 3  #压缩级别
-----------------------------------------------------------------------------------------------------
# 重启filebeat
[root@elk03 ~]# systemctl restart filebeat
# 检查进程
[root@logstash ~]#  ps -ef | grep filebeat
[root@logstash ~]#  ps -ef | grep filebeat
root       8947      1  0 14:04 ?        00:00:00 /usr/share/filebeat/bin/filebeat -c /etc/filebeat/filebeat.yml -path.home /usr/share/filebeat -path.config /etc/filebeat -path.data /var/lib/filebeat -path.logs /var/log/filebeat
root       8970   8105  0 14:04 pts/2    00:00:00 grep --color=auto filebeat
#编辑logstash配置文件
[root@logstash conf.d]# vim /etc/logstash/conf.d/nginx_log.conf
-----------------------------------------------------------------------------------------------------
input {
    beats {
        port => "100"
        codec => "json"
    }
}
filter{
    json{
        source => "message"
        remove_field => ["message"]
    }
}
output{
    elasticsearch{
        hosts => ["10.0.0.81:9200"]
        index => "%{type}-%{+yyyy.MM.dd}"
        codec => "json"
    }
}
-----------------------------------------------------------------------------------------------------
#语法检测
[root@logstash conf.d]# /usr/share/logstash/bin/logstash -f /etc/logstash/conf.d/nginx_log.conf  -t
OpenJDK 64-Bit Server VM warning: If the number of processors is expected to increase from one, then you should configure the number of parallel GC threads appropriately using -XX:ParallelGCThreads=N
WARNING: Could not find logstash.yml which is typically located in $LS_HOME/config or /etc/logstash. You can specify the path using --path.settings. Continuing using the defaults
Could not find log4j2 configuration at path /usr/share/logstash/config/log4j2.properties. Using default config which logs to console
Configuration OK   #//出现OK表示正确
14:30:50.091 [LogStash::Runner] INFO  logstash.runner - Using config.test_and_exit mode. Config Validation Result: OK. Exiting Logstash
#启动logstash
[root@logstash conf.d]# /usr/share/logstash/bin/logstash -f /etc/logstash/conf.d/nginx_log.conf
#检查端口   //查看100端口是否开启
[root@logstash ~]# netstat -lntup
Active Internet connections (only servers)
Proto Recv-Q Send-Q Local Address           Foreign Address         State       PID/Program name      tcp6       0      0 :::514                  :::*                    LISTEN      6905/rsyslogd
tcp6       0      0 :::100                  :::*                    LISTEN      9426/java
#浏览器刷新nginx页面,访问10.0.0.81:9100 查看是否上传ES成功,刷新会比较慢,等待即可;如果较长时间没有刷新出来,建议重新启动logstash或者检查配置文件是否正确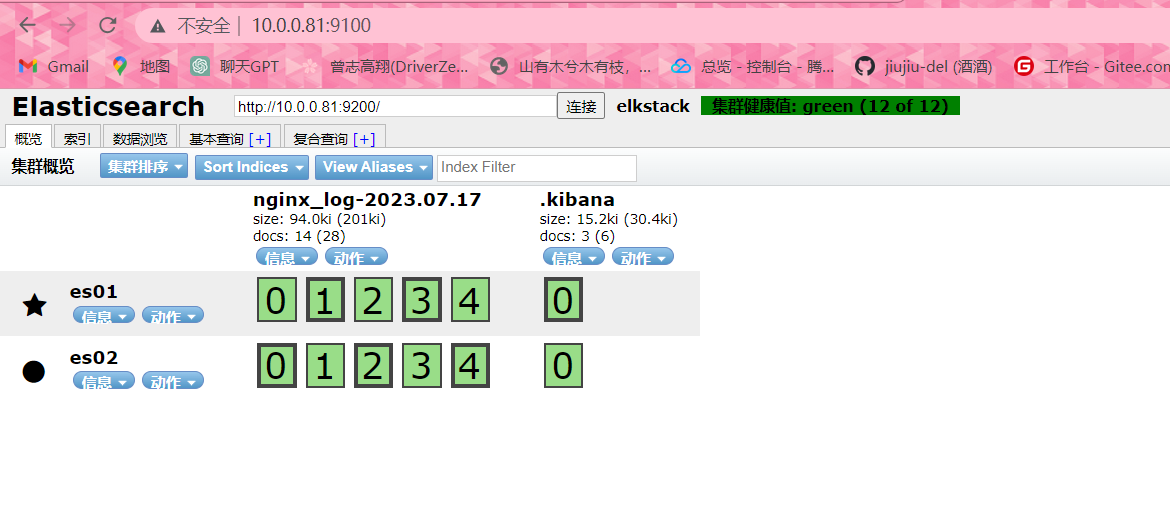
filebeat将日志输出到redis
安装redis
# 下载redis包
[root@db01 ~]# wget http://download.redis.io/releases/redis-3.2.12.tar.gz
# 解压包
[root@db01 ~]# tar xf redis-3.2.12.tar.gz
# 创建目录 编辑软链接
[root@db01 ~]# mkdir /app
[root@db01 ~]# mv redis-3.2.12 /app/
[root@db01 ~]# ln -s /app/redis-3.2.12/ /app/redis
# 编译
[root@db01 ~]# cd /app/redis
[root@db01 ~]# make
# 添加环境变量
[root@db01 ~]# vim /etc/profile.d/redis.sh
export PATH="/app/redis/src:$PATH"
#环境变量生效
[root@db01 redis]# source /etc/profile
# 创建配置文件目录
[root@db01 ~]# mkdir -p /data/6379
[root@db01 ~]# vim /data/6379/redis.conf
port 6379
daemonize yes
pidfile /data/6379/redis.pid
logfile "/data/6379/redis.log"
dbfilename dump.rdb
dir /data/6379
protected-mode no
# 启动服务
[root@db01 ~]# redis-server /data/6379/redis.conf
编写filebest配置文件
vim /etc/filebeat/filebeat.yml
-----------------------------------------------------------------------------------------------------
filebeat.prospectors:
- input_type: log
  paths:
    - /var/log/messages
  exclude_lines: ["^DBG","^$"]
  document_type: messages_log
output.redis:
  hosts: ["10.0.0.51:6379"]
  key: 'service_log'   # redis里key名称
  db: 6    # 设置6库
  timeout: 5  # 设置超时时间
#  passwd: xxx   # redis密码 没有就不写
-----------------------------------------------------------------------------------------------------
#重启服务
[root@logstash ~]# systemctl restart filebeat.service
编写logstash配置文件,取出redis中的日志数据
# 编写logstash的配置文件
[root@logstash ~]# vim /etc/logstash/conf.d/messages.conf
input{
    redis{
        data_type => 'list'
        key => 'service_log'
        host => '10.0.0.51'
        port => '6379'
        db => '6'
        codec => 'json'
    }
}
filter{
    json{
        source => 'message'
        remove_field => ['message']
    }
}
output{
    elasticsearch{
        hosts => ['10.0.0.81:9200']
        index => '%{type}-%{+yyyy.MM.dd}'
    }
}
# 启动
[root@logstash ~]# /usr/share/logstash/bin/logstash -f /etc/logstash/conf.d/messages.conf
# 查看redis
[root@db01 redis]# redis-cli
127.0.0.1:6379> select 6
OK
127.0.0.1:6379[6]> keys *
1) "service_log"
# 访问10.0.0.81:9100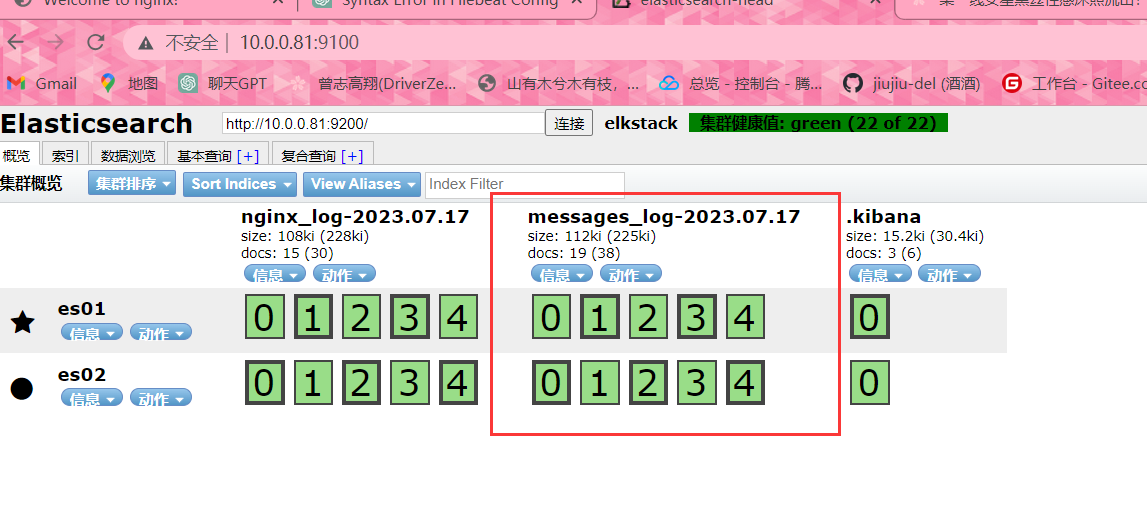
练习
1、将logstash添加到系统命令中
#添加环境变量
[root@logstash ~]# vim .bashrc
export PATH="/usr/share/logstash/bin/:$PATH"
#生效
[root@logstash ~]# source .bashrc
#命令测试
[root@logstash ~]# logstash -e 'input { stdin{} } output { stdout{ codec => rubydebug }}'
OpenJDK 64-Bit Server VM warning: If the number of processors is expected to increase from one, then you should configure the number of parallel GC threads appropriately using -XX:ParallelGCThreads=N
WARNING: Could not find logstash.yml which is typically located in $LS_HOME/config or /etc/logstash. You can specify the path using --path.settings. Continuing using the defaults
Could not find log4j2 configuration at path /usr/share/logstash/config/log4j2.properties. Using default config which logs to console
17:39:36.790 [[main]-pipeline-manager] INFO logstash.pipeline - Starting pipeline {"id"=>"main", "pipeline.workers"=>1, "pipeline.batch.size"=>125, "pipeline.batch.delay"=>5, "pipeline.max_inflight"=>125}
17:39:36.842 [[main]-pipeline-manager] INFO logstash.pipeline - Pipeline main started
The stdin plugin is now waiting for input:
17:39:36.970 [Api Webserver] INFO logstash.agent - Successfully started Logstash API endpoint {:port=>9600}
log
{
"@timestamp" => 2023-07-11T09:40:23.326Z,
"@version" => "1",
"host" => "logstash",
"message" => "log"
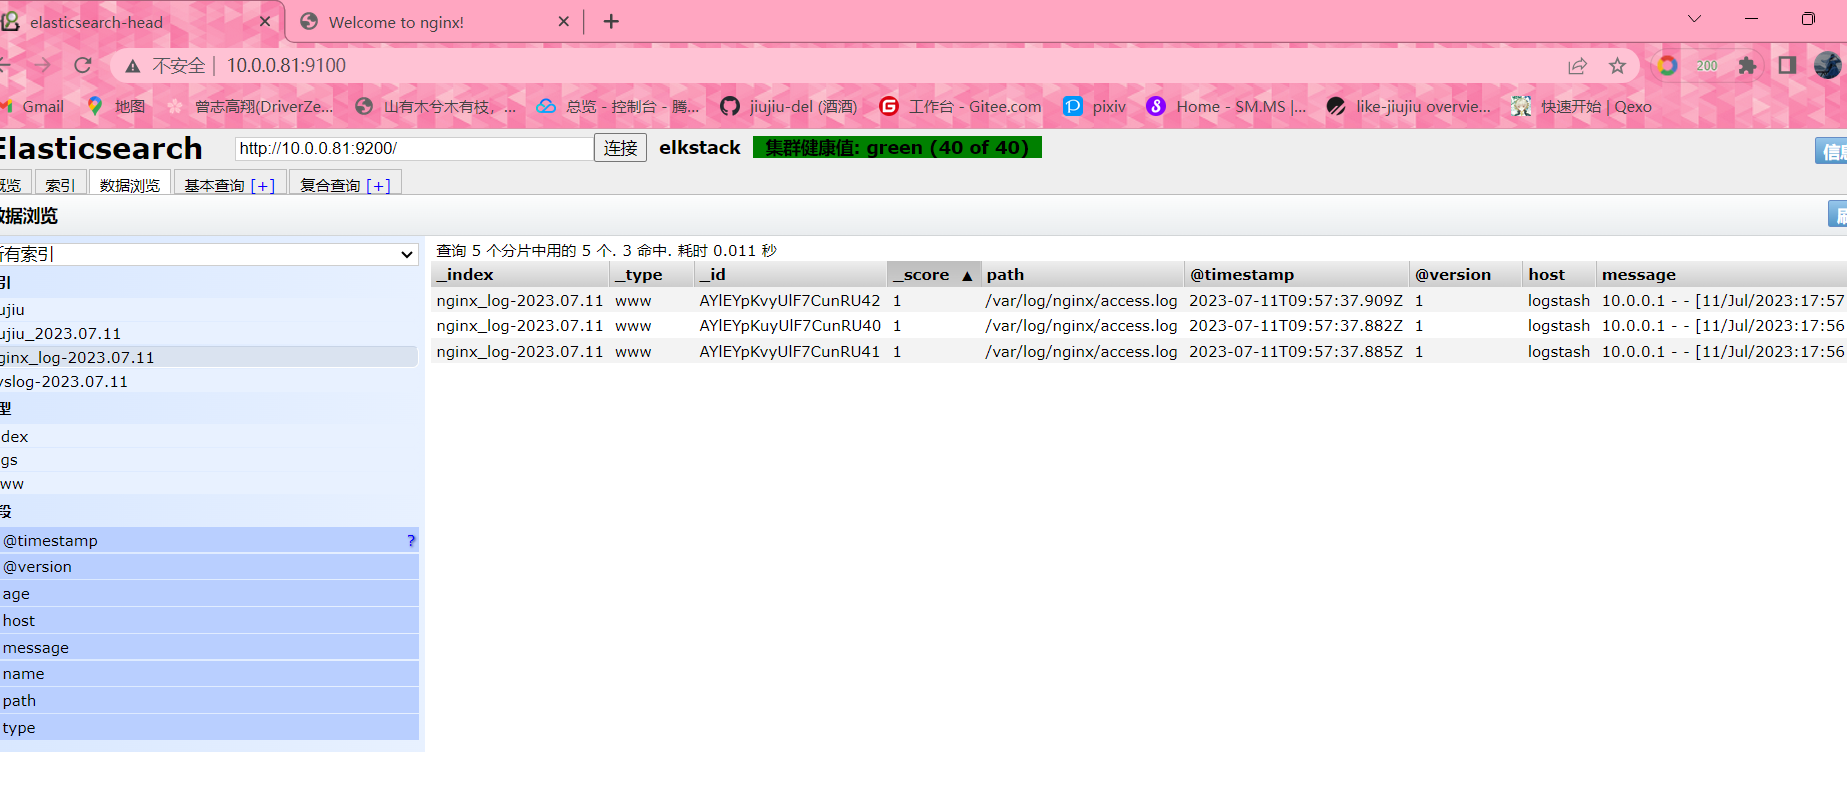
}2、通过logstash收集本机Nginx日志
#启动nginx
[root@logstash ~]# systemctl start nginx
#访问页面刷新
10.0.0.83
#从标准输入到Elasticsearch
[root@logstash ~]# logstash -e 'input { file { type => "www" path => "/var/log/nginx/access.log" start_position => "beginning" } } output { elasticsearch { hosts => ["10.0.0.81:9200"] index => "nginx_log-%{+YYYY.MM.dd}" } }'
3、通过logstash收集本机tomcat日志
#安装tomcat
tar xf -C apache-tomcat-9.0.78.tar.gz  /opt
#启动服务
/opt/apache-tomcat-9.0.78/bin/./startup.sh
#启动logstash
logstash -e 'input { file { type => "www" path => "/opt/apache-tomcat-9.0.78/logs/localhost.2023-07-11.log" start_position => "beginning" } } output { elasticsearch { hosts => ["10.0.0.81:9200"] index => "tomcat_log-%{+YYYY.MM.dd}" } }'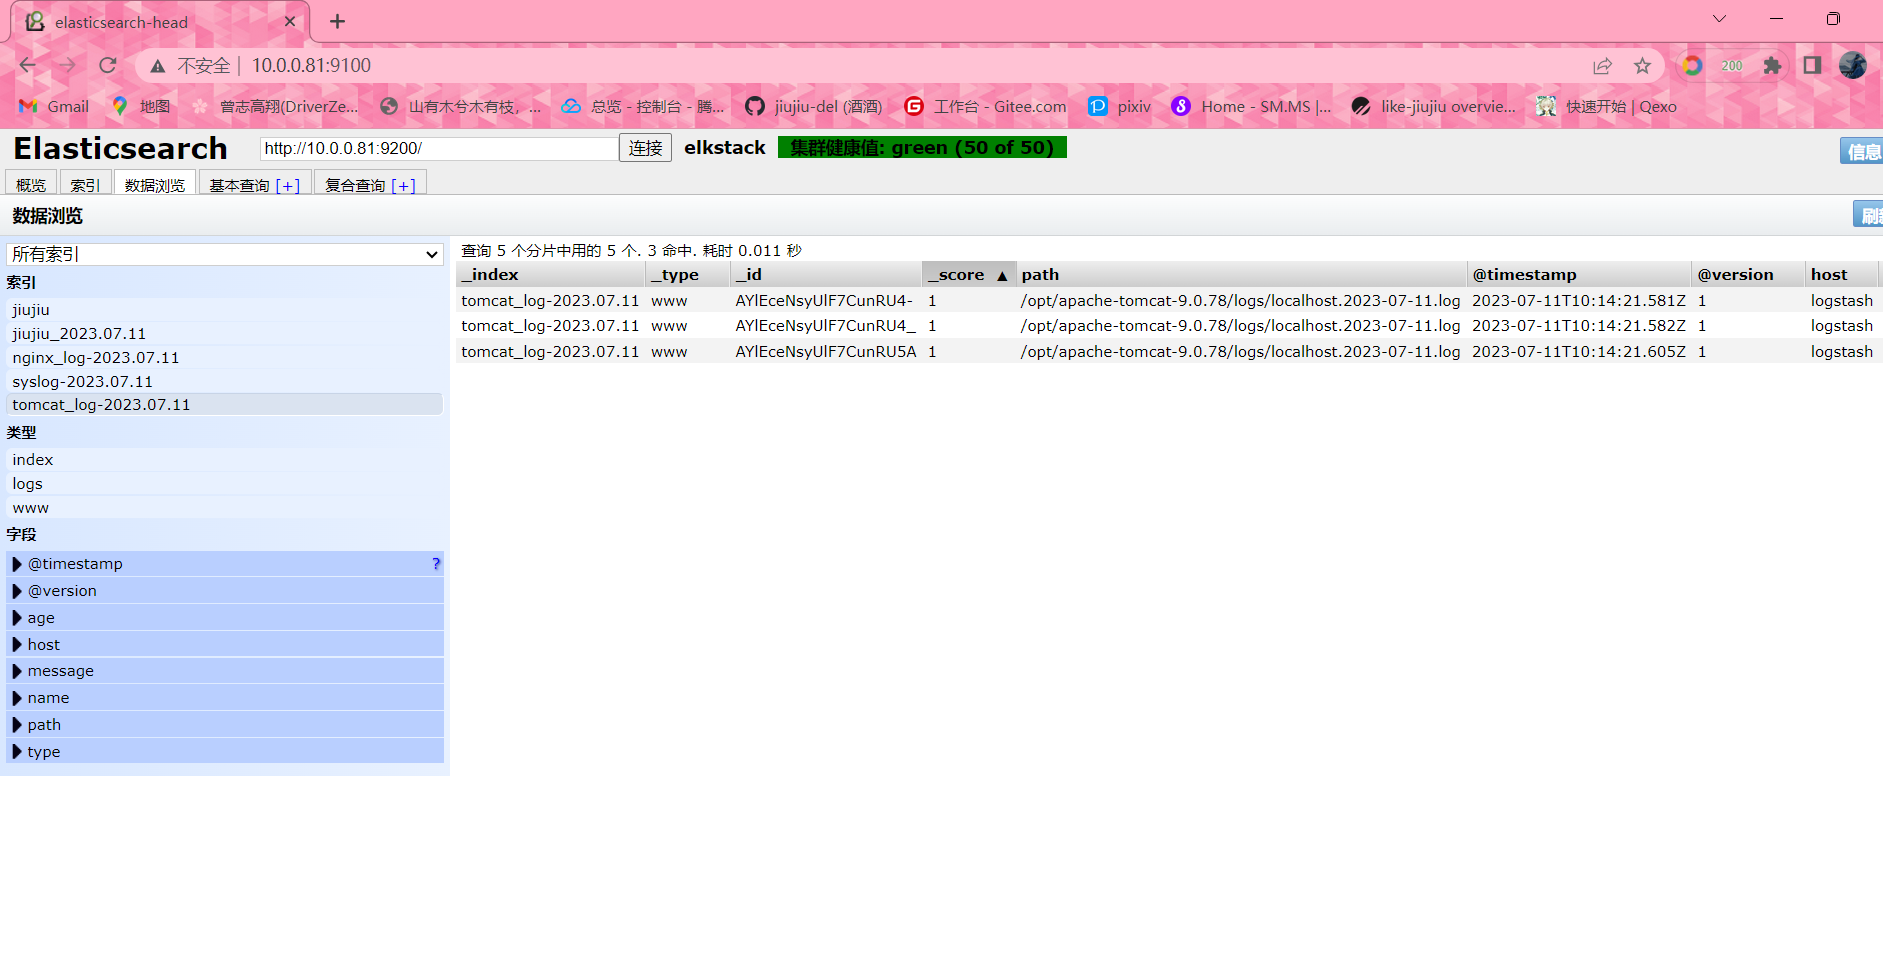
4、修改nignx日志文件为JSon格式
#修改nginx日志格式
vim /etc/nginx/nginx.conf
log_format json_format 'clientip":"$remote_addr", "ClientUser":"$remote_user", "authenticated":"$remote_user", "AccessTime":"$time_local", "method":"$request_method", "status":"$status", "SendBytes":"$body_bytes_sent", "Query?string":"$query_string", "partner":"$http_referer", "AgentVersion":"$http_user_agent';
access_log /var/log/nginx/access.log json_format;
#启动nginx
systemctl start nginx
#查看日志
[root@logstash ~]# tail -f /var/log/nginx/access.log
clientip":"10.0.0.1", "ClientUser":"-", "authenticated":"-", "AccessTime":"12/Jul/2023:14:55:15 +0800", "method":"GET", "status":"304", "SendBytes":"0", "Query?string":"-", "partner":"-", "AgentVersion":"Mozilla/5.0 (Windows NT 10.0; Win64; x64) AppleWebKit/537.36 (KHTML, like Gecko) Chrome/114.0.0.0 Safari/537.36
clientip":"10.0.0.1", "ClientUser":"-", "authenticated":"-", "AccessTime":"12/Jul/2023:14:55:16 +0800", "method":"GET", "status":"304", "SendBytes":"0", "Query?string":"-", "partner":"-", "AgentVersion":"Mozilla/5.0 (Windows NT 10.0; Win64; x64) AppleWebKit/537.36 (KHTML, like Gecko) Chrome/114.0.0.0 Safari/537.36
#编写logstash配置文件
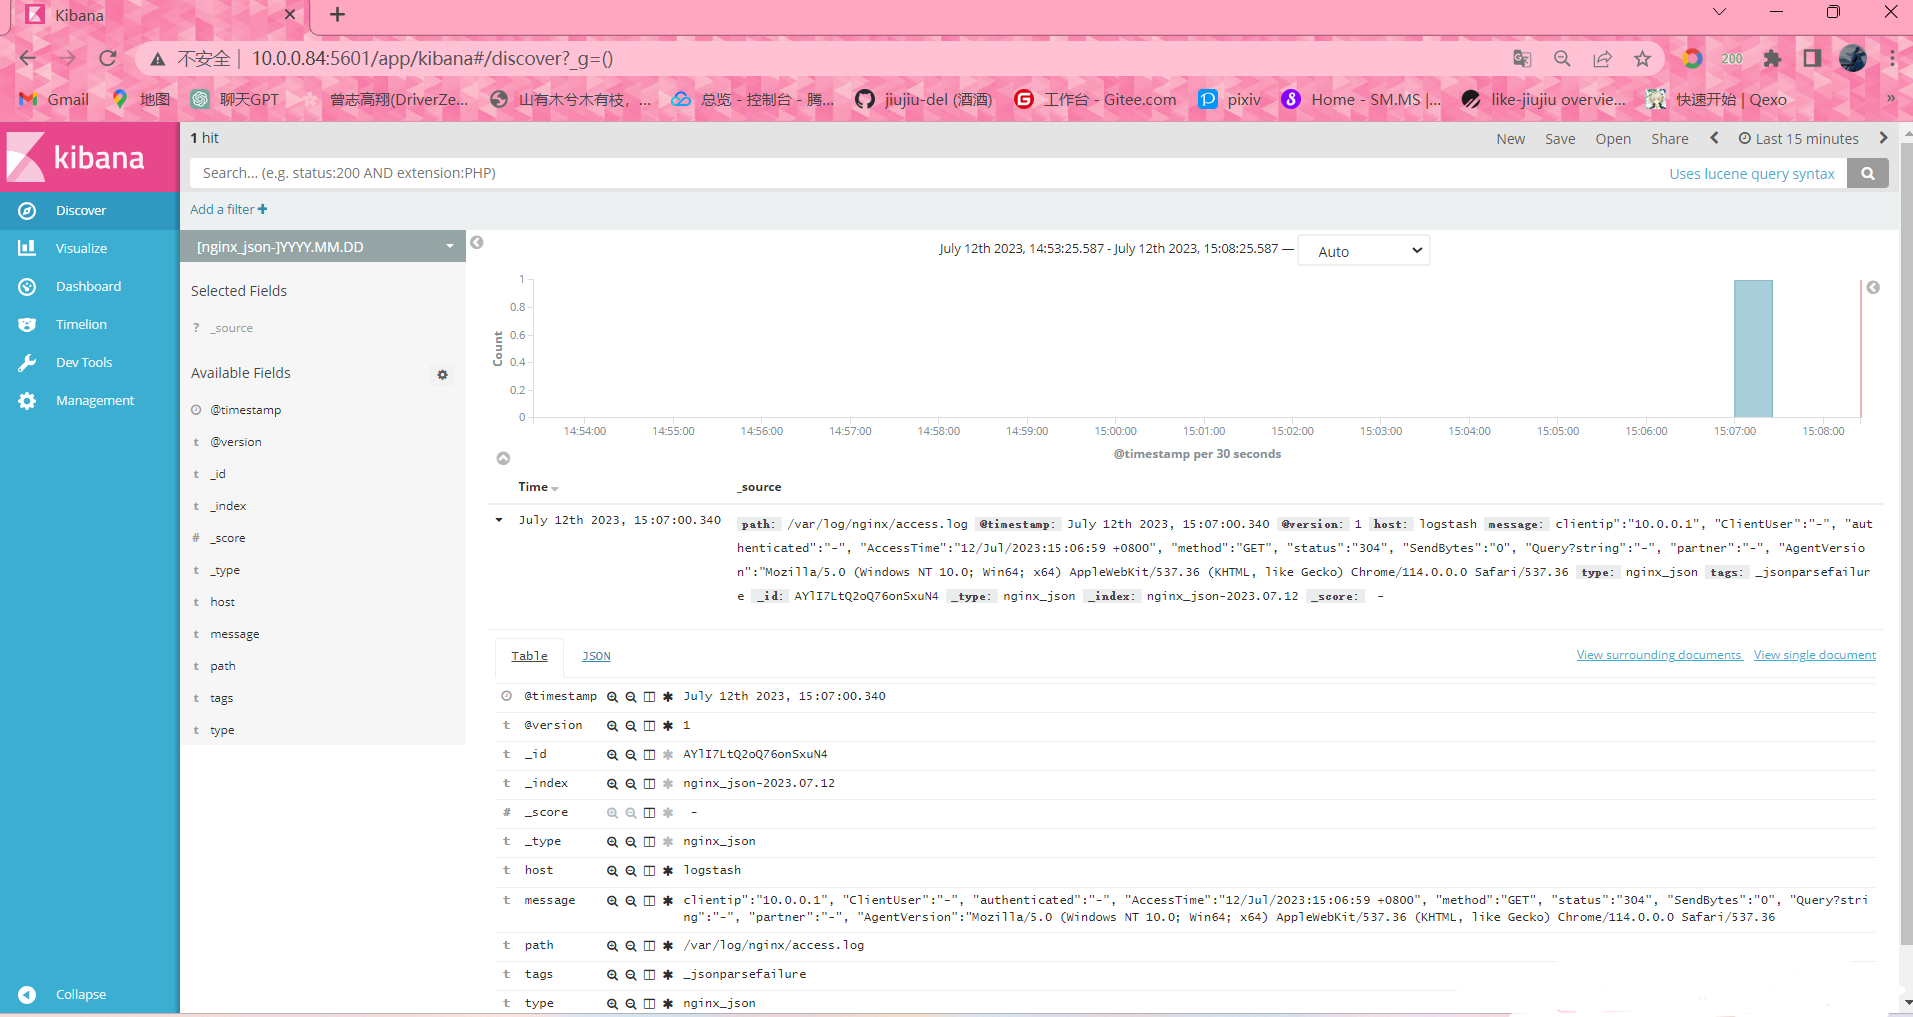
[root@logstash ~]# vim /etc/logstash/conf.d/nginx_json.conf
input{
file{
type => "nginx_json"
path => "/var/log/nginx/access.log"
start_position => "end"
}
}
filter{
json{
source => 'message'
}
}
output{
elasticsearch{
hosts => ["10.0.0.81:9200"]
index => "%{type}-%{+yyyy.MM.dd}"
}
}
#启动logstash
[root@logstash ~]# logstash -f /etc/logstash/conf.d/nginx_json.conf
#logstash浏览器访问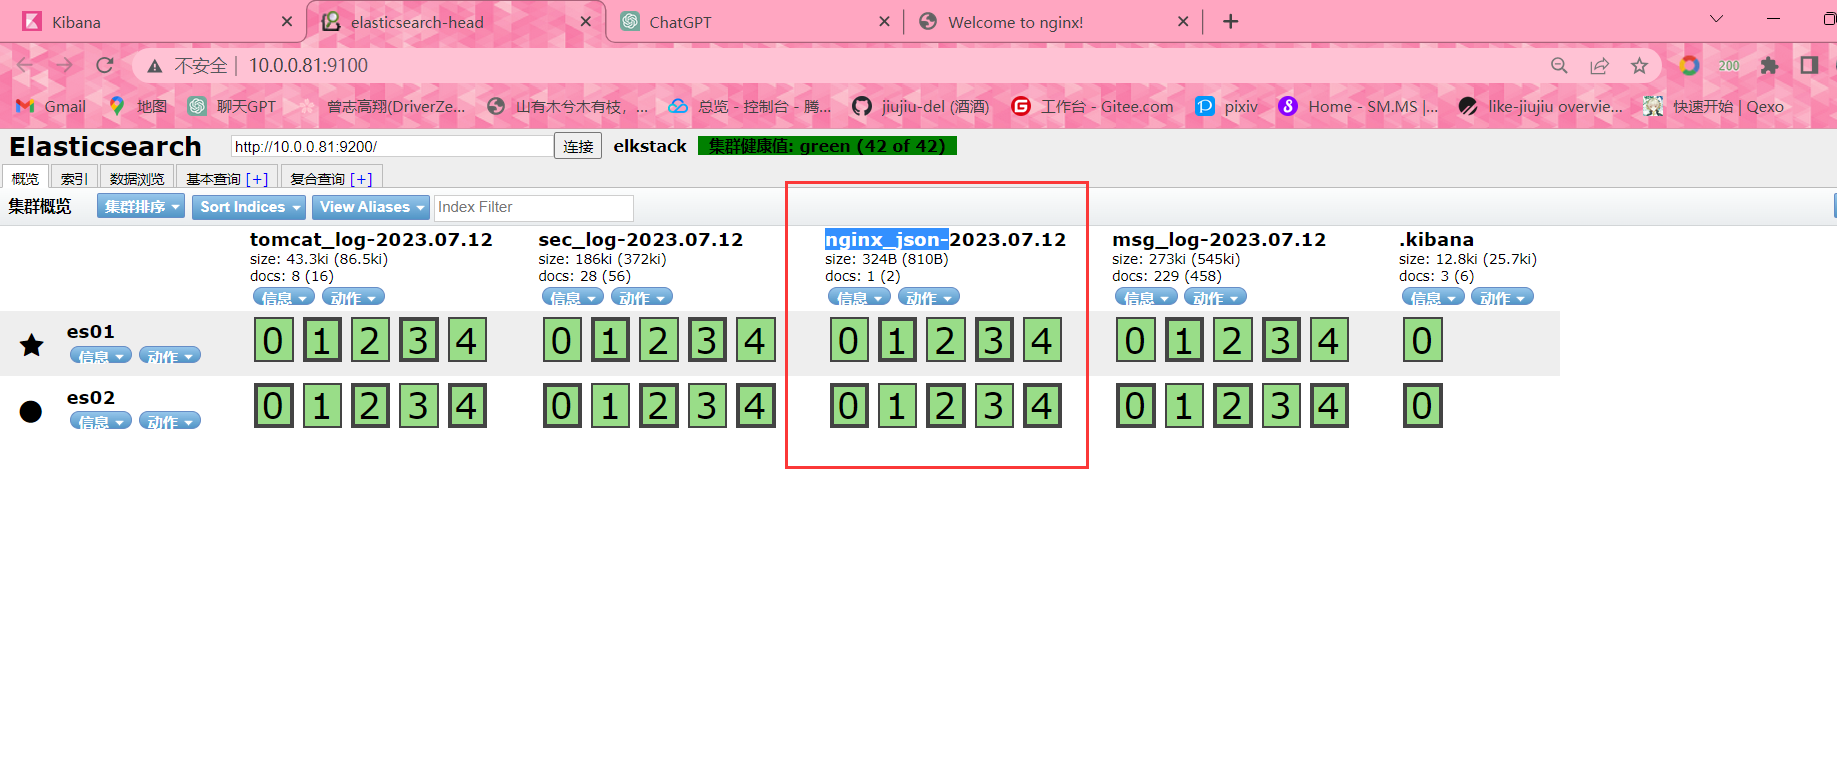
#添加至kibana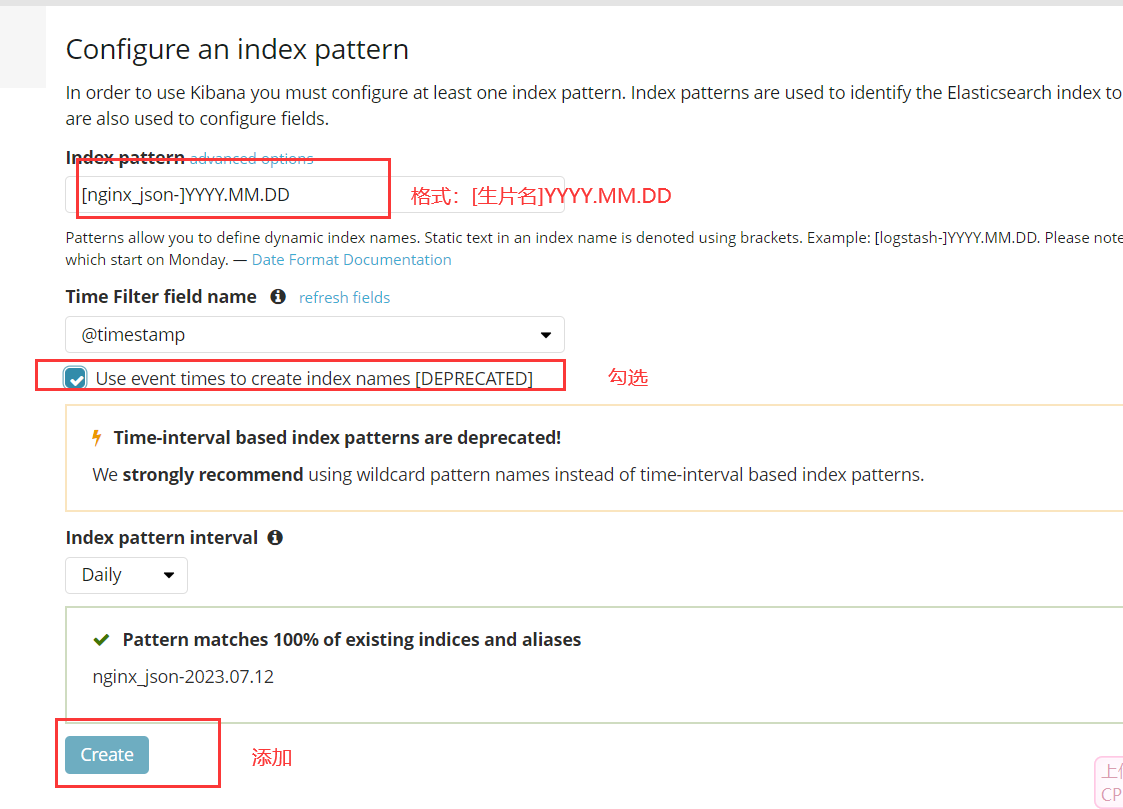
#Kibana浏览器访问